
XEQT holds about ten times as many companies as GEQT. GEQT puts 64% of its money in two sectors. And its largest position, Nvidia, weighs almost twice as much as it does in XEQT.
Both are all-in-one ETFs. Both are 100% stocks. They are not the same bet.
Here is my take before we start. One is a broad market investment. The other is a big bet on tech and financials, even though it is built around your values.
*Disclosure: I do not own XEQT or GEQT. I own Apple, Microsoft, Alphabet and Broadcom, which appear in these ETFs. This is education, not advice. Do your own due diligence.
Here is the full comparison on video if you would rather watch it than read it.
What Are XEQT and GEQT?
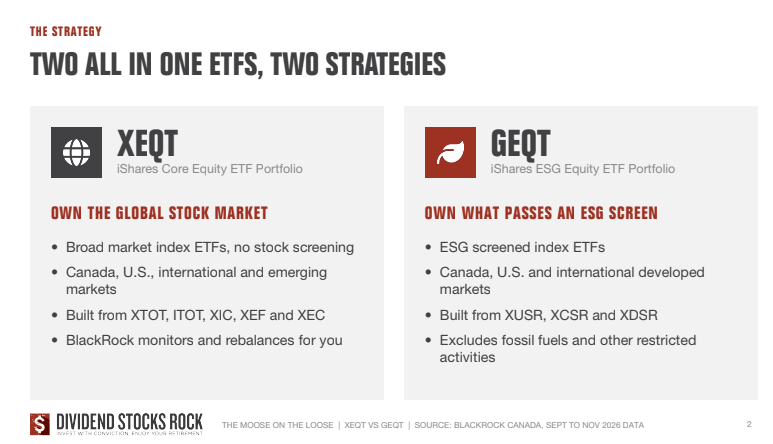
Two all-in-one equity ETFs. XEQT buys the world, with 8,000 to 9,000 stocks. GEQT is an ESG-screened version with about 800 stocks and no emerging markets.
The idea is the same for both. You buy one ETF, it holds a basket of country ETFs, and it rebalances automatically.
XEQT touches Canada, the US, international and emerging markets. You are everywhere. Almost too much everywhere, because you reach up to 9,000 companies.
GEQT has a similar structure, with one ETF per region. The most important difference is that it is ESG screened: environmental, social and good governance. It excludes fossil fuels, among other things.
One note on that. Read the rules and look at the companies. Whether a stock qualifies as ESG is debatable and depends on your point of view and values.
How Do XEQT and GEQT Compare Side by Side?
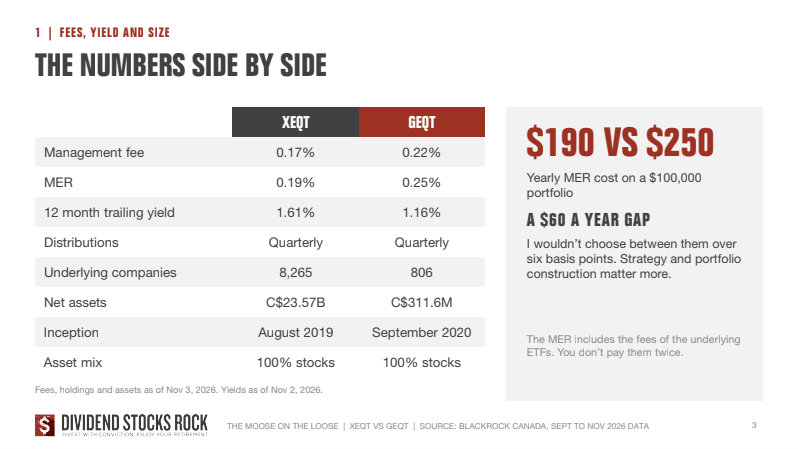
Fees and yield are close. Size is not. XEQT has $23.6 billion in net assets and GEQT about $311 million.
Fees: XEQT charges a management fee of 0.17%, reduced in late 2025, and GEQT 0.22%. With the underlying ETFs included, the MER is 0.19% and 0.25%. On $100,000, that is $190 against $250 a year, a $60 gap. Nothing to write home about.
Trailing yield: 1.61% for XEQT and 1.16% for GEQT. Both are low-yield, high-growth products. You will not make a difference here either.
Underlying companies: this is where they split. XEQT holds between 8,000 and 9,000 stocks. GEQT holds about 800.
Net assets: $23.6 billion for XEQT, a popular ETF. About $311 million for GEQT. Not the same ballpark.
Inception: August 2019 for XEQT, September 2020 for GEQT. That gives a little over five years to compare returns. Useful, but not a long track record.
Where Do They Invest?
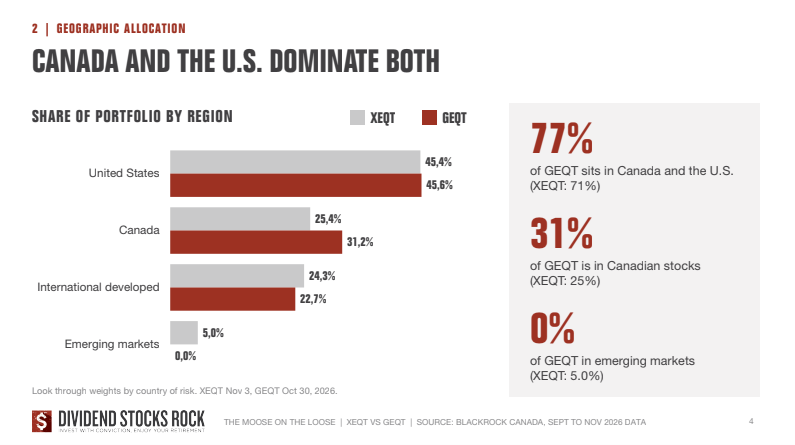
Mostly in North America. About 70% for XEQT and 77% for GEQT.
Both hold between 40% and 45% in US stocks. Canada is 25% in XEQT and 31% in GEQT. International markets take 23% of GEQT, with no exposure to emerging markets. XEQT holds more international and adds emerging markets.
So with either one, you are basically investing in North America.
How Concentrated Is GEQT?
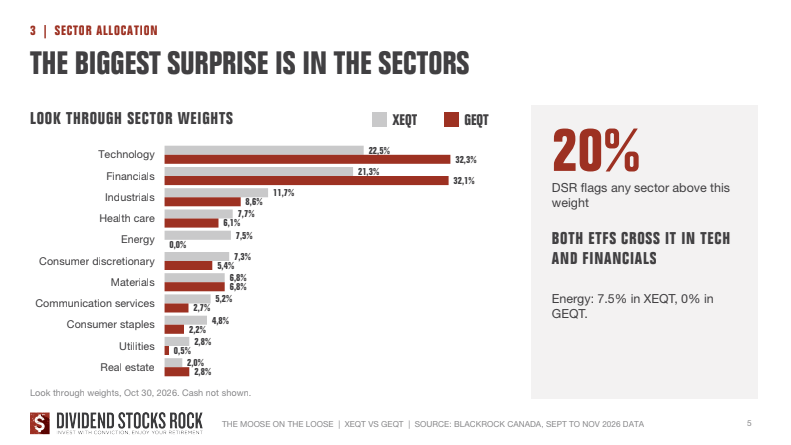
Very. Technology and financials each take 32% of GEQT, for 64% of the portfolio. In XEQT, those two sectors add up to 44%.
The sectors were the biggest surprise. GEQT has 0% in energy, as you would expect. Then technology at 32% and financials at 32%.
Technology and financials are doing well right now. That’s great. I am still not sure you want two-thirds of your portfolio in two sectors.
At DSR, we flag any sector above 20%. XEQT sits right around that line with technology at 22% and financials at 21%. After that, it spreads out: industrials at 11%, healthcare at 7.7%, energy at 7.5%, and so on.
For GEQT, it is really those two sectors. Add industrials at 8.6% and healthcare at 6%, and you have the bulk of the portfolio. Both ETFs hold very little in communication services, consumer staples, utilities and real estate.
That 20-point gap matters if you are retired. A portfolio this concentrated can swing very fast.
What Do the Top Holdings Show?
GEQT leans on Nvidia and the Canadian banks. Its top 25 positions make up 39% of the ETF, against 28% for XEQT.
Both like Nvidia. It is about 3% of XEQT and 5.7% of GEQT.
In XEQT, the weights drop fast. Apple is near 3%, Microsoft at 2.4%, Royal Bank at 2%, then Amazon at 1.5%, and the 10th largest position, Bank of Montreal, sits at 0.85%.
GEQT looks completely different. TD Bank at 3.3%, Royal Bank at 3%, Broadcom and Shopify near 3% each, Bank of Montreal and Scotiabank near 2% each. Then Micron at 1.8%, CIBC at 1.74% and AMD at 1.49%. The theme is easy to see: financials and technology.
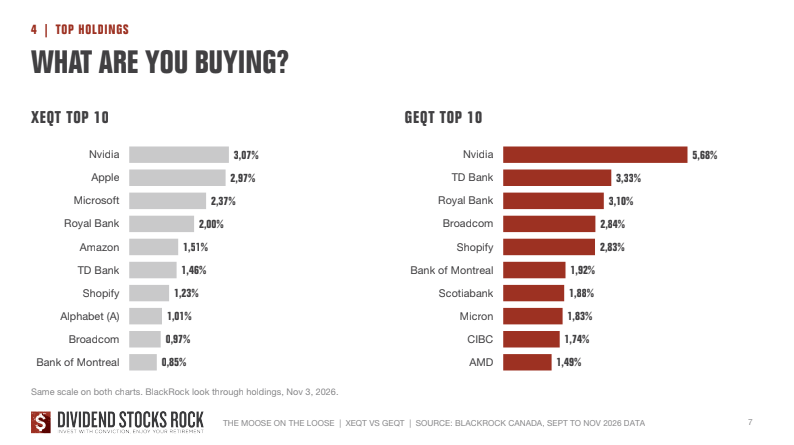
Three things stand out with GEQT. The big Nvidia weight. Zero Apple, Microsoft, Amazon or Alphabet. And no Meta or Tesla either, while XEQT holds all of them.
You can debate whether Apple or Microsoft are less ESG than Nvidia. I don’t have an opinion on that. You can ask yourself if it is worth it.
Even with 800 companies, GEQT’s top 25 is close to 40% of your money.
Which One Performed Better?
About the same so far. GEQT is slightly ahead since inception. In 2022, though, XEQT fell 11% and GEQT fell 15.7%.
2022 was a bad year for the stock market, and GEQT took the bigger hit. With 800 stocks, you might think it is well diversified. It isn’t diversified enough.
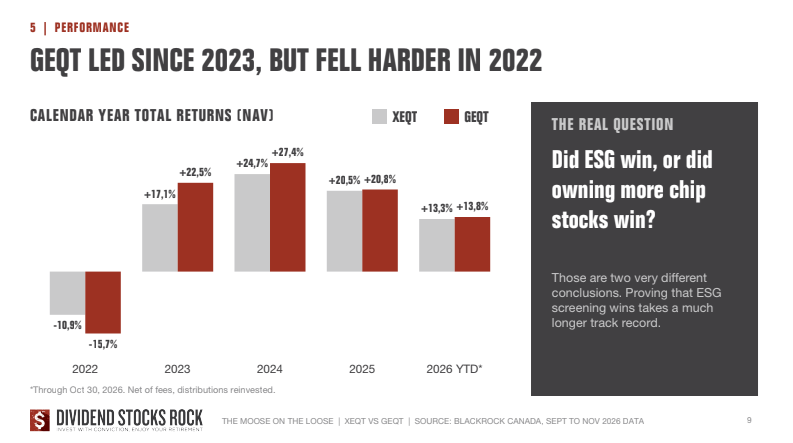
The big question is whether ESG beat the regular market, or whether GEQT simply holds more chip and semiconductor stocks. That is what has been driving the stock market lately, up and down.
Can These ETFs Pay for Your Retirement?
Not through the yield. Both pay well under 2%. The money comes from total return, and you sell units to create your income.
I covered this a few weeks ago on a Retirement Friday episode of The Moose on the Loose. Selling units works, and it can generate more income than focusing on income ETFs. The numbers prove it, even through a prolonged bear market like 2008.
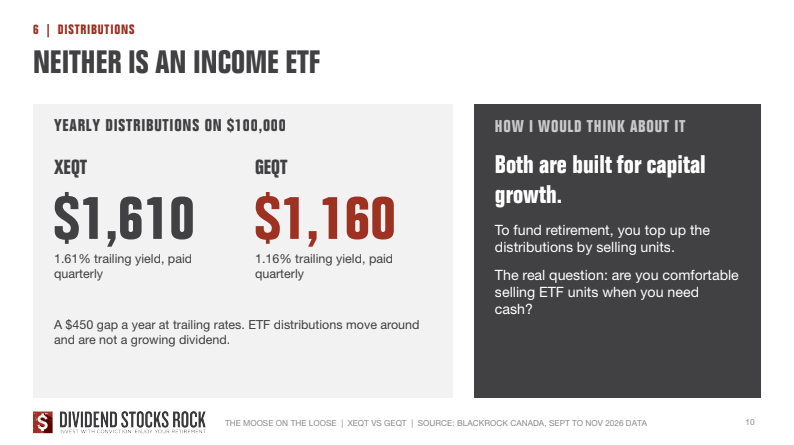
In December, I will show Retirement Loop members step by step how selling units to generate income works, and why it holds up.
What Are the Risks?
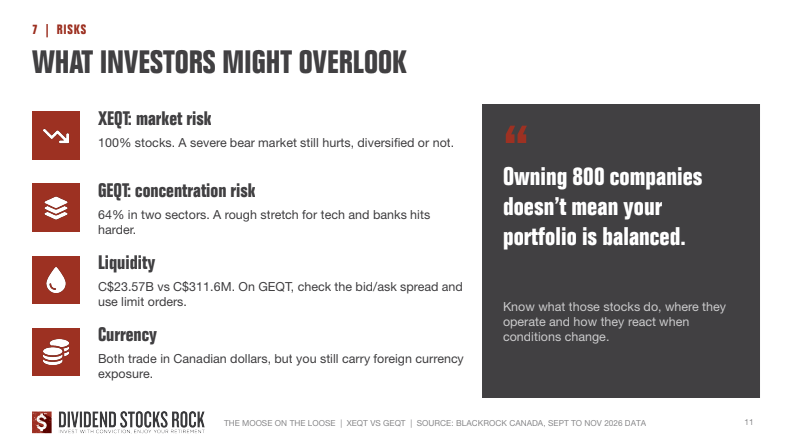
Four of them. Both are 100% stocks. GEQT is concentrated. GEQT is small, which can widen the bid and ask spread. And both carry currency risk.
100% stocks. Right now it feels like unicorns and rainbows, with double digit returns every year. There is risk there, especially if you are retired. On my side, I will be 100% invested in stocks for the rest of my life. That’s just me. It isn’t necessarily you.
Concentration. 64% in two sectors is a bit too much for my taste. Again, that’s just me.
Liquidity. Check the bid and ask spread on any ETF. XEQT has $23.6 billion in assets, GEQT about $300 million. A smaller ETF can show a bigger spread, which matters for limit orders, and even more if you sell in a panic (which you should not do, but it happens).
Currency. Both trade in Canadian dollars. You still carry foreign currency risk through the US dollar, the euro and Asian currencies. Keep that in mind as you walk into retirement.
XEQT or GEQT: Which One Is Best for You?
It depends on the bet you want. XEQT buys the broad market. GEQT is a big bet on tech and financials built on an ESG screen.
Ask yourself three questions before you pick either one.
- Do you want the broad market or a screened version of it? GEQT is the ESG version. With XEQT, you buy the world.
- Are you comfortable with the concentration? If you like GEQT, you could pair it with something else to lower the exposure to tech and financials.
- What is your investment objective? Are you comfortable managing a portfolio built on total return, and generating your own income in retirement? If yes, both are great products. If not, you might want to add fixed income, more dividend-paying stocks or another strategy.
The key is always the same. Find a strategy you understand, one you are comfortable with, and one you will stick to when your portfolio is down 10%. That is how you live a happy retirement.
Build Your Retirement Income Plan Before Christmas
Once you pick your ETF, the next question is how to turn it into a paycheck for the rest of your life.
Retirement Loop is my community for Canadians who want to build and follow their own retirement plan. The doors are open now. In December, members get the full webinar on selling units to generate income, step by step.






Leave a Reply