In 2016, I made a life-changing decision: I took a sabbatical, put my family in a small RV, and drove to Costa Rica.
Upon my return in 2017, I officially quit my job as a private banker at National Bank and started working full-time on my baby: Dividend Stocks Rock. I also decided to manage my pension account held at the National Bank. I’ve built this portfolio publicly since 2017 to make a real-life case study. I decided to invest 100% of this money in dividend growth stocks.
In August 2017, I received $108,760.02 in a locked retirement account. This means I can’t add capital to the account, and growth is only generated through capital gains and dividends. I don’t report this portfolio’s results to brag about my returns or to tell you to follow my lead. I just want to share how I manage my portfolio monthly with all the good and the bad. I hope you can learn from my experience.
You can read the most recent and complete report here.
Now, here’s what you’ll find in this case study portfolio!
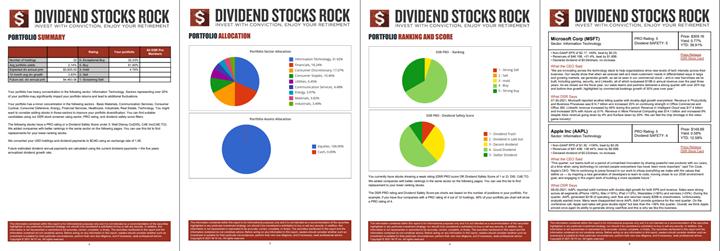
The Dividend Guy Pension Portfolio
The Dividend Triangle Tool
You can’t look at my holdings without knowing about the dividend triangle! My dividend growth stocks are selected based on it, which is a simple yet very effective tool.
I coined the term Dividend Triangle to refer to a trio of metrics for which there has to be a growth trend for a company to be a potential dividend grower: revenue, earnings per share (EPS), and dividend amount.
The dividend triangle is a strong indicator of the likelihood of a dividend cut and can, at a glance, reveal the cause of a stock’s performance, good or bad. It also makes finding good stocks much easier. Searching for a great combination of its three metrics quickly narrows down your search from thousands of stocks to hundreds, which you narrow down further using other criteria.
Best Place to Get Stock Ideas
While you can find the information about these three metrics online, it can turn into a monk’s work. This is why I created the Dividend Rock Stars List, a list of over 300 companies showing growing dividend triangle trends. Save yourself some hard work, and enter your name and email below to get the list in your mailbox.
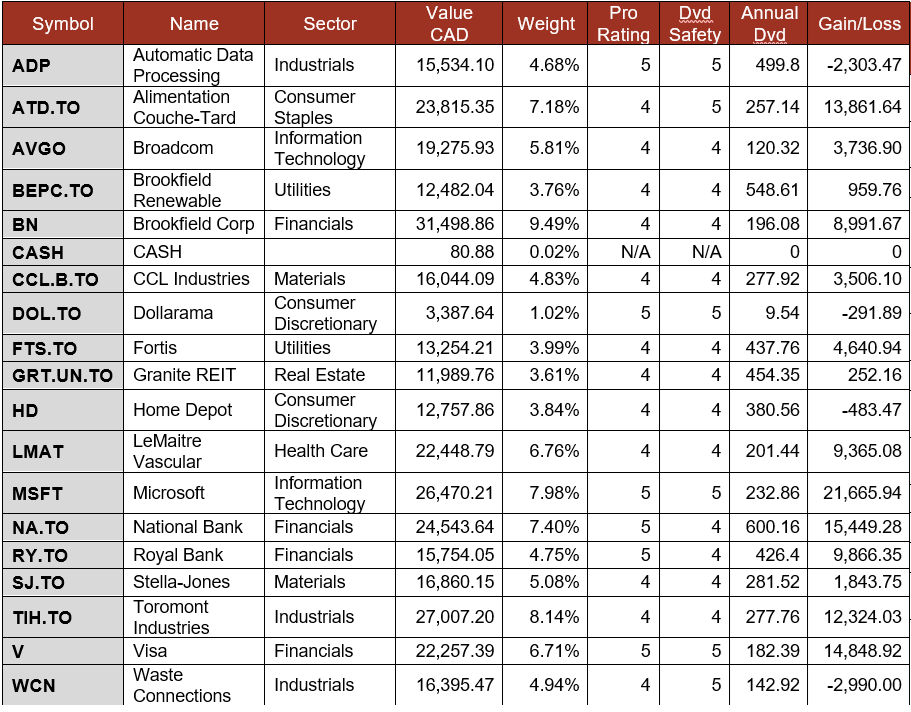
My Entire Portfolio Updated for Q4 2025
Each quarter, we run an exclusive report for Dividend Stocks Rock (DSR) members who subscribe to our very special additional service called DSR PRO. The PRO report includes a summary of each company’s earnings report for the period. We have been doing this for an entire year now and I wanted to share my own DSR PRO report for this portfolio. You can download the full PDF showing all the information about all my holdings. Results have been updated as of April 7th, 2026. Next quarterly report will be available in July.