

In 2016, I made a life-changing decision: I took a sabbatical, put my family in a small RV, and drove to Costa Rica.
Upon my return in 2017, I officially quit my job as a private banker at National Bank and started working full-time on my baby: Dividend Stocks Rock. I also decided to manage my pension account held at the National Bank. I’ve built this portfolio publicly since 2017 to make a real-life case study. I decided to invest 100% of this money in dividend growth stocks.
In August 2017, I received $108,760.02 in a locked retirement account. This means I can’t add capital to the account, and growth is only generated through capital gains and dividends. I don’t report this portfolio’s results to brag about my returns or to tell you to follow my lead. I just want to share how I manage my portfolio monthly with all the good and the bad. I hope you can learn from my experience.
I sold a winner
Selling is like saying goodbye; it’s hard to let go, especially when you were in a good relationship!
I sold one of my winners in February. Let’s use this as an example of how to apply these selling rules.
Performance in Review
Let’s start with the numbers as of February 12th, 2025 (before the bell):
Original amount invested in September 2017 (no additional capital added): $108,760.02.
- Current portfolio value: $298,402.23
- Dividends paid: $5,152.47 (TTM)
- Average yield: 1.73%
- 2024 performance: +26.00%
- VFV.TO= +35.24%, XIU.TO = +20.72%
- Dividend growth: +12.22%
Total return since inception (Sep 2017 – January 2025): 174.36%
Annualized return (since September 2017 – 88 months): 14.94%
Vanguard S&P 500 Index ETF (VFV.TO) annualized return (since Sept 2017): 17.02% (total return 212.60%)
iShares S&P/TSX 60 ETF (XIU.TO) annualized return (since Sept 2017): 11.30% (total return 117.30%)
When Do You Sell When You Have Made Money?
Selling is like saying goodbye; it’s hard to let go, especially when you were in a good relationship!
If you’ve followed my portfolio for a while, you probably know I’m about to tell you that I sold my BlackRock (BLK) shares in February.
I keep saying that my #1 sell rule is when a company I hold doesn’t match my investment thesis and financial metrics, I must let it go.
I’ve reinforced this rule since I got burned by Algonquin (AQN) a few years ago. I let the investment thesis take up too much room in my thinking and didn’t focus enough on the financial metrics. It’s important to learn from your mistakes.
Back to BlackRock – Why did I sell a performing asset that was up 165%?
In 2017, I added BlackRock to my portfolio as the company showed a perfect dividend triangle and a robust investment thesis.
BlackRock’s investment thesis in 2017
The company was the world’s largest asset manager and also the world’s largest ETF manufacturer. This was enough to secure its present and its future. BLK built strong relationships with institutional investors. Banks, pension plan managers, and other investment firms tend to stick with large asset managers for a long time. BlackRock offers a wide range of investment products using the same playbook: it charges a recurring fee on the assets under management. Regardless of where people invest, as long as it was with BlackRock, the company made money. With such a strong investment narrative, you could expect a strong dividend triangle.
2017 BLK Dividend Triangle
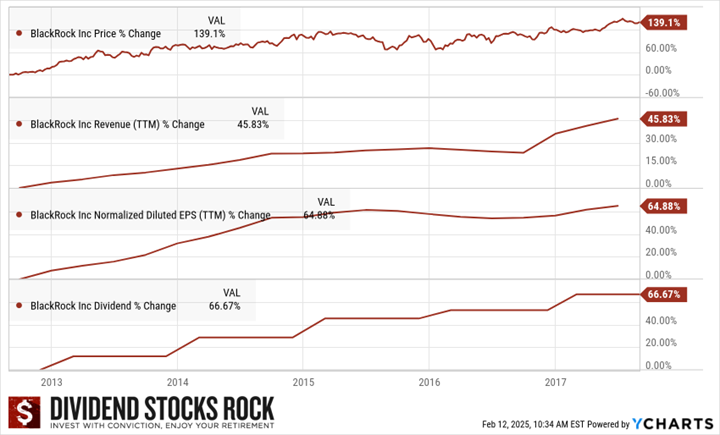
When you look at the numbers from 2012 to 2017, the company reported steady revenue and EPS growth. Even better, the dividend grew at the same pace the EPS did during that period (64.88% and 66.67%, respectively).
So, I pulled the trigger toward the end of 2017 with conviction. I had found a great company with a great story and great numbers. Everything was there for a successful investment story.
For fun, please note that I bought BLK close to its 5-year all-time high (around $420). This highlights that a stock’s all-time high is highly relative and doesn’t give you much indication as to when it’s a good time to buy.
Fast-forward to today. The only time I could have bought BLK at a cheaper price was during a few days in March 2020, when the world was convinced it would be in lockdown for years.
BlackRock is an interesting case study as I sold it for a nice profit even though the company’s investment thesis is still intact. However, some metrics aren’t as strong as before.
2025 BLK Dividend Triangle
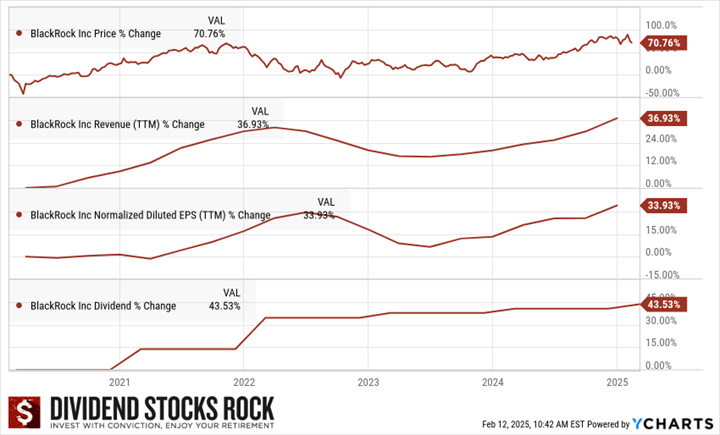
When you look at today’s dividend triangle, the company still shows robust numbers, even weaker than in 2017. Revenue and EPS are back in growth mode after a difficult period in 2022. This is totally normal, as you can’t expect companies to thrive each quarter for the next 50 years.
When you look at the 5-year dividend growth, it’s still very solid at 43.53% (or a 7.5% annualized growth rate!).
However, since I monitor my holdings closely, I have noticed that BLK slowed down its dividend growth policy in 2023 when management offered a 2.6% increase (from $4.88 to $5.00). That was a small red flag back then. After all, 2022 was a bad year and management could have been being simply prudent.
Then, management offered a 2% increase in 2024 (from $5.00 to $5.10). I wasn’t pleased and I started talking about watching BLK closely.
2025 was the final nail in the coffin, with another weak increase of 2.17% (from $5.10 to $5.21). I sold my shares because BLK was no longer a strong dividend grower. My strategy is to invest in companies offering continuing generous dividend increases.
The Only List Using the Dividend Triangle
As you noticed, I handpick companies with a strong dividend triangle (revenue, earnings, and dividend growth trends) and make sure I understand their business model. While this may seem too simple, two decades of investing have shown me it is reliable.
While many seasoned investors also use these metrics in their analysis, no one has created a list based on them before. This is exactly why I created The Dividend Rock Stars List.
The Rock Stars List isn’t just about yield—it’s built using a multi-step screening process to ensure the highest-quality dividend stocks.
Enter your name and email below to get the instant download in your mailbox.
How long should you wait?

It took me 3 years of weak dividend increases to decide on this holding.
You can all notice weaker metrics on the stocks you follow. A bad economy could bring revenue down, or a bad move could hurt EPS for a few years.
It’s important to be patient and understand that companies won’t constantly thrive and impress for decades.
But how long is long enough and not too long?
I have been investing since 2003. One of my biggest lessons is that patience goes a long way with my portfolio.
However, the problem is that I’m never sure that being patient might morph into complacency.
Being patient with stocks like Disney (DIS) or Magna International (MG.TO) didn’t pay much. I didn’t lose money, but I could have made much more if I had cut the cord faster and moved on to better investments.
However, patience with a stock like Blackrock offered me a great return. I would have made a lot less if I had sold in 2023 after the first weak dividend increase. I’ve experienced similar results by being patient with Starbucks (SBUX) or Texas Instruments (TXN).
Set a deadline and monitor in the meantime
I don’t have a hard rule for patience, as each company and situation is different. However, I always use the same framework.
- I establish a clear timeframe (in this case, it was 3 dividend announcements or 3 years).
- I monitor the company closely during that period to see improvement.
As I just mentioned, each situation is different. For BlackRock, the only problem was the weak dividend increases. The thesis was still valid, and the company reported steady growth.
I have a Telus (T.TO) position in one of my other portfolios. I’ve actively monitored its cash flow metrics (operating cash flow, capital expenditures, and free cash flow strong enough to cover the dividend).
While Telus has demonstrated improvements for all cash flow metrics, the “final decision” will be made this year once management shares its dividend growth policy.
For years (until 2025), management maintained a high single-digit dividend growth rate policy, which will be reviewed this year.
The company didn’t mention it in its latest earnings report, which is concerning. I discuss it in the episode below.
I can never be sure to be right or wrong with this framework.
However, it’s simple and straightforward enough that I can move quickly and with conviction. Until I find a crystal ball, I’ll be happy with this methodology!
Smith Manoeuvre Update
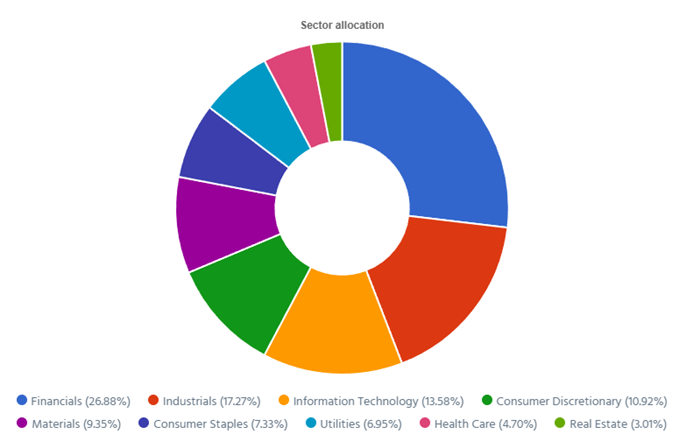
Slowly but surely, the portfolio is taking shape with 13 companies spread across 8 sectors.
My goal is to build a portfolio of thriving companies with a solid dividend triangle (e.g. with positive revenue, EPS and dividend growth trends). The current portfolio yield is at 3.98% with a 5-year CAGR dividend growth rate of 8.98%.
Increasing the Smith Manoeuvre amount
Starting in March, I will increase my Smith Manoeuvre contribution from $500 to $750 monthly.
My 2025 goal is to reach $1,000 per month toward my SM portfolio. I’ve cleared my car loans, and I will use some of the free cash flow to fuel this strategy.
Here’s my SM portfolio as of February 12th, 2025 (before the bell):
| Company Name | Ticker | Sector | Market Value |
| Alimentation Couche-Tard | ATD.TO | Consumer Staple | $1,449.80 |
| Brookfield Infrastructure | BIPC.TO | Utilities | $1,162.00 |
| Canadian National Resources | CNQ.TO | Energy | $1,590.48 |
| Capital Power | CPX.TO | Utilities | $1,519.60 |
| Canadian Tire | CTA.A.TO | Consumer Disc. | $1,109.64 |
| Exchange Income | EIF.TO | Industrials | $1,681.60 |
| Franco-Nevada | FNV.TO | Materials | 1,224.18 |
| Great-West Lifeco | GWO.TO | Financials | $869.55 |
| National Bank | NA.TO | Financials | $1,380.06 |
| Nutrien | NTR.TO | Materials | $961.48 |
| Telus | T.TO | Communications | $1,270.63 |
| TD Bank | TD.TO | Financials | $1,213.66 |
| Waste Connections | WCN.TO | Industrials | $1,356.75 |
| Cash (Margin) | $104.20 | ||
| Total | $16,893.63 | ||
| Amount borrowed | -$14,500.00 |
A full position in Waste Connections
Not too long ago, I initiated a new position in Waste Connections (WCN.TO). This play is articulated around two themes:
- A company with a strong dividend triangle (all metrics pointing in the same direction).
- A company that won’t be affected by tariffs.
I have shared my complete investment thesis in the video below.
Let’s look at my CDN portfolio. Numbers are as of February 12th, 2025 (before the bell):
Canadian Portfolio (CAD)
| Company Name | Ticker | Sector | Market Value |
| Alimentation Couche-Tard | ATD.B.TO | Cons. Staples | $21,674.51 |
| Brookfield Renewable | BEPC.TO | Utilities | $9,796.26 |
| CCL Industries | CCL.B.TO | Materials | $13,436.66 |
| Fortis | FTS.TO | Utilities | $10,731.96 |
| Granite REIT | GRT.UN.TO | Real Estate | $8,789.76 |
| National Bank | NA.TO | Financials | $15,180.66 |
| Royal Bank | RY.TO | Financial | $10,998.90 |
| Stella Jones | SJ.TO | Materials | $14,649.39 |
| Toromont Industries | TIH.TO | Industrials | $14,551.40 |
| Cash | $214.73 | ||
| Total | $120,014.23 |
My account shows a variation of -$3,609.89 (-2.92%) since January’s income report. I’ll report Canadian earnings next month, in addition to Brookfield Renewable.
Brookfield Renewable keeps up with good numbers and no love from the market
Brookfield Renewable reported another solid quarter with FFO per unit up 21%.
The company’s hydroelectric, wind, solar, and distributed energy businesses all contributed positively despite weaker North American hydrology affecting hydroelectric generation.
Revenue was up 8% fueled by inflation-linked contracts, contributions from acquisitions, and organic growth initiatives. BEPC announced a 5% dividend increase. Congrats!
The company reaffirmed its 10%+ annual FFO per unit growth target and remains optimistic about future revenue expansion through re-contracting opportunities and inflation-linked pricing adjustments.
Here’s my US portfolio now. Numbers are as of February 12th, 2025 (before the bell):
U.S. Portfolio (USD)
| Company Name | Ticker | Sector | Market Value |
| Apple | AAPL | Inf. Technology | $9,304.80 |
| Automatic Data Processing | ADP | Industrials | $11,619.64 |
| Brookfield Corp. | BN | Financials | $20,127.24 |
| Home Depot | HD | Cons. Discret. | $12,490.80 |
| LeMaitre Vascular | LMAT | Healthcare | $9,694.00 |
| Microsoft | MSFT | Inf. Technology | $19,337.68 |
| Starbucks | SBUX | Cons. Discret. | $10,436.82 |
| Visa | V | Financials | $17,536.00 |
| Waste Connections | WCN | Industrials | $14,244.75 |
| Cash | $24.95 | ||
| Total | $124,816.68 |
My account shows a variation of +$4,517.26 (+3.76%) since January’s income report.
Apple shows strong Services revenue growth
Apple reported a solid quarter, with revenue up 4% and EPS up 10%, easily beating analysts’ expectations.
This growth was primarily driven by strong Services revenue, which reached an all-time high of $26.3B, up 14%. The Products segment grew marginally to $97.96B from $96.46B, with strength in Mac (up 16%) and iPad (up 15%) sales offsetting a slight decline in iPhone revenue (-0.8%).
Geographically, Apple saw strong performance in the Americas (+4.4%), Europe (+11.4%), and Japan (+15.7%), while China sales declined (-11%) due to macroeconomic challenges and increased competition.
EPS was fueled by higher margins from its services segment and an optimized supply chain.
Automatic Data Processing is a money printing machine
Automatic Data Processing reported a solid quarter with revenue up 8% and EPS up 10%, which easily beat analysts’ expectations.
The growth was driven by strong demand for human capital management (HCM) solutions and increased interest on client funds. Segment breakdown: Employer Services Revenue +8%, driven by new business bookings and higher client retention. Employer Services segment margins expanded by 90 basis points, while the PEO Services segment margin declined by 140 basis points, reflecting a shift in cost structure.
Find Other Thriving Companies: Download the Dividend Rock Stars List
This dividend stock list is updated monthly. You will receive the updated version every month by subscribing to our newsletter. You can download the list by entering your email below.
This isn’t a list of high-yield stocks—it’s a handpicked selection of the best dividend growth stocks backed by detailed financial analysis.
—> Monthly updates
—> Full dividend safety ratings
—> 10+ Metrics with filters
Enter your email to get the latest Dividend Rock Stars List now!
My last BlackRock earnings review
BlackRock reported a solid quarter with revenue up 23% and EPS up 23.5%, which easily beat analysts’ expectations.
This growth was driven by strong market performance, 7% organic base fee growth, increased technology service revenue, and additional fees from the Global Infrastructure Partners (GIP) acquisition. Investment advisory and administration fees were a key contributor, increasing $812M due to higher assets under management (AUM) and positive market trends.
BlackRock enters 2025 with a strong outlook, supported by its record $11.6T in AUM and $641B in full-year net inflows (including $281B in Q4 alone).
BLK also increased its dividend by 2%, which does not cover the current inflation rate.
Microsoft is fueled by AI and clouds
Microsoft reported a strong quarter with revenue up 12% and EPS up 10%, which beat analysts’ expectations.
The company’s growth was largely driven by cloud and AI-related services. The segment breakdown is as follows: Productivity and Business Processes +14%, Intelligent Cloud +19% (with Azure up 31% and total cloud revenue at $40.9 billion (+21% YoY), More Personal Computing flat.
CEO Satya Nadella highlighted that Microsoft’s AI business has surpassed a $13 billion annual run rate, up 175% YoY, showcasing rapid AI adoption across industries.
Starbucks’ first steps of “Back to Starbucks” seems to please their investors
Starbucks reported better-than-expected results despite a double-digit declining EPS (-23%) and flat revenue (-0.29%).
The company faced a 4% decline in global comparable store sales, driven by a 6% drop in transactions, partially offset by a 3% increase in average ticket size. North American revenue declined by 1%, impacted by a 4% decline in comparable store sales, driven by an 8% drop in transactions despite a 4% increase in average ticket. International revenue was up 1%, supported by new store openings (+9%).
Turnaround efforts are in the early stages with the “Back to Starbucks” strategy focused on operational efficiency, store growth, and brand rebuilding.
Vero and I discussed SBUX in this podcast episode.
Bull & Bear Cases for Troubled Stocks—Do you own them? [Podcast]
Visa is… Visa!
Visa reported another solid quarter with revenue up 10% and EPS up 14%, easily beating the analysts’ expectations.
This growth was driven by strong payment volume (+9%), cross-border volume (+16%), and processed transactions (+11%). The International Transaction segment saw the highest growth at +14%, reflecting increased travel and cross-border commerce. Service revenues increased 8%, while data processing revenue grew 9%. Client incentives rose 13%, reflecting Visa’s continued partnerships with financial institutions.
Management highlighted strong consumer spending trends, digital payment adoption, and new partnerships as drivers of continued momentum in 2025.
Replacing BlackRock with Waste Connections
I’ve already outlined why I added WCN to my Smith Maneuver portfolio in the previous updates. I’m following the same strategy and now have a full position in this great company.
I’m confident in my ability to hold WCN for several years, read decades, considering its sticky business and strong dividend triangle. But as was the case with BlackRock, you never know!
My Entire Portfolio Updated for Q4 2024
Each quarter, we run an exclusive report for Dividend Stocks Rock (DSR) members who subscribe to our special additional service, DSR PRO.
The PRO report includes a summary of each company’s earnings report for the period. I wanted to share my own DSR PRO report for this portfolio.
You can download the full PDF showing all the information about all my holdings. Results have been updated as of January 2nd, 2025.
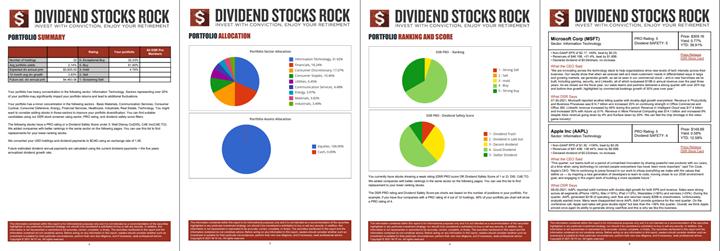
Download my portfolio Q4 2024 report.
Dividend Income: $150.62 CAD (+182% vs January 2024)
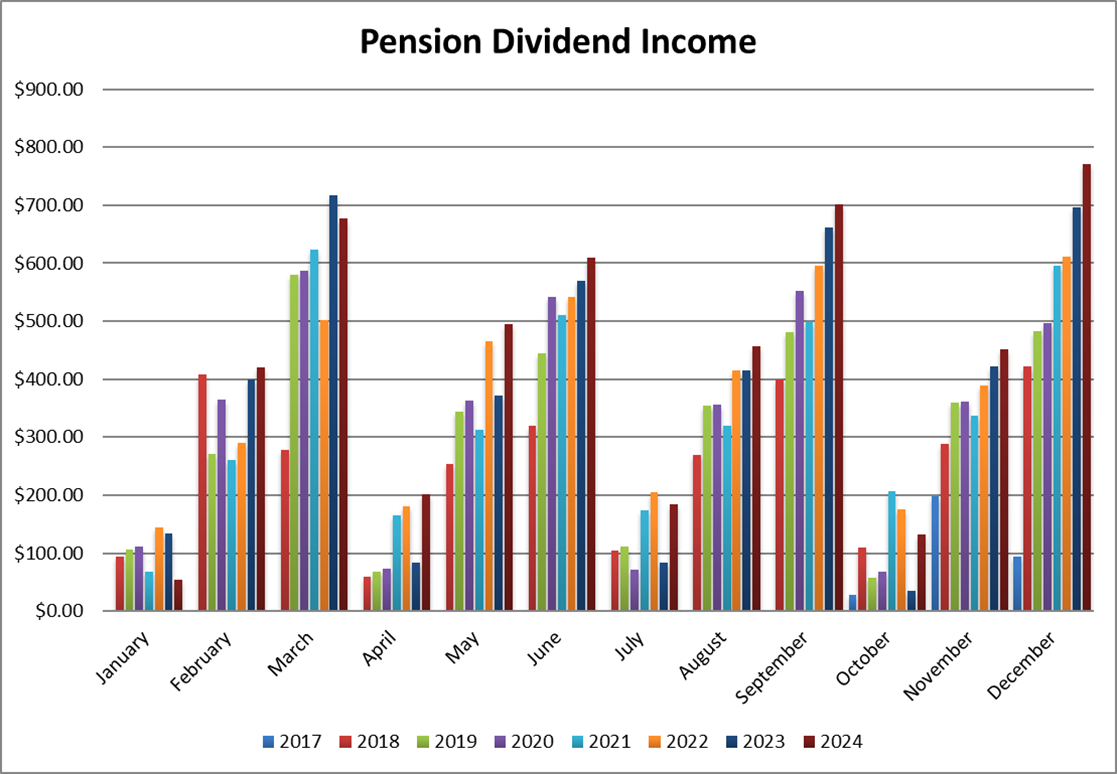
This month, I benefited from dividends paid by new additions to my portfolio over the past 12 months.
Toromont Industries and Automatic Data Processing are new dividend growers paying in January.
I always count on a stable dividend coming from Granite as well.
| CDN DIVIDENDS: $66.98 | US DIVIDENDS: $58.52 |
| Granite REIT: $36.26 (+3.01%) | Automatic Data Processing: $58.52 (new) |
| Toromont: $30.72 (new) | Currency USD/CAD: 1.4292 (+7.86%) |
| TOTAL DIVIDENDS RECEIVED: $150.62 (+182%) | |
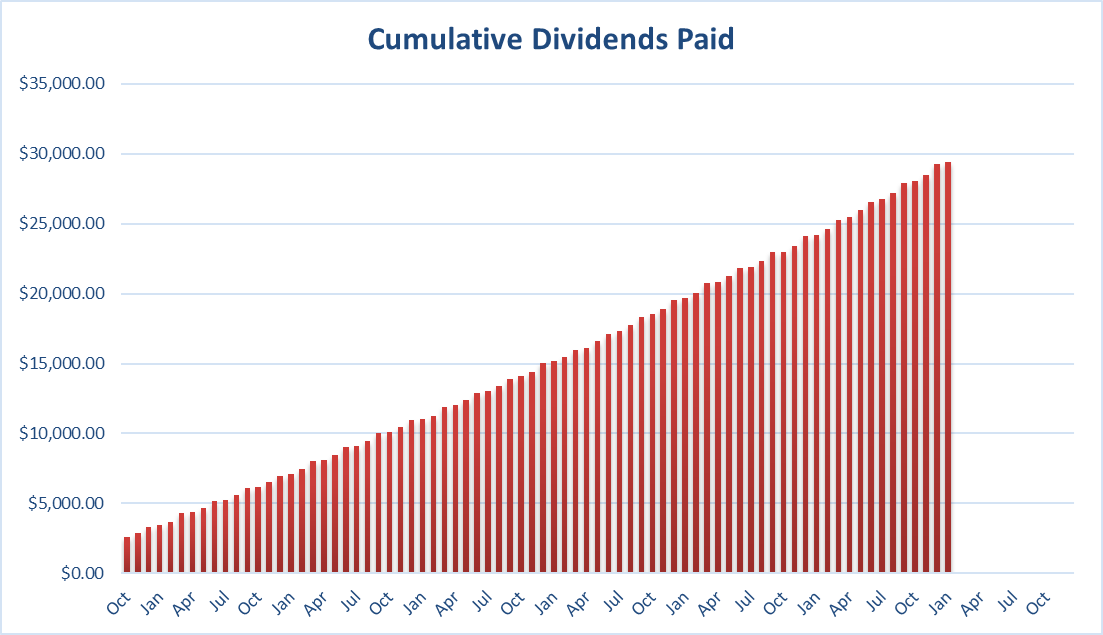
Since I started this portfolio in September 2017, I have received a total of $29,416.59 CAD in dividends. Keep in mind that this is a “pure dividend growth portfolio” as no capital can be added to this account other than retained and/or reinvested dividends.
Therefore, all dividend growth comes from the stocks and not from any additional capital added to the account.
Final Thoughts
That was a busy month as I sold my BLK shares and added WCN to my portfolio. Each year, I never expect to exercise many transactions. After all, my goal is to keep my shares for decades.
Unfortunately, the economy changes, companies change, and then, I must adapt my portfolio accordingly.
I will remain patient and often may wait a few years each time I think of making a move. This framework has worked great for several years, and I will continue to use it.
Once again, I never assess a company based on its 5-year (or less) price return. That’s just noise.
Cheers,
Mike.


No need to publish this; just wanted to thank you for publishing a blog article and not a video. I do not watch investment vids and prefer articles but that is probably just me. If you had put that article in a vid it would be way way too long. Again just my opinion. Keep up the good work.