

In 2016, I made a life-changing decision: I took a sabbatical, put my family in a small RV, and we drove all the way to Costa Rica.
Upon my return in 2017, I officially quit my job as a private banker at National Bank and started working full-time on my baby: Dividend Stocks Rock. I also decided to manage my pension account held at the National Bank. I’ve built and managed this portfolio publicly since 2017 to create and track a real-life case study.
In August 2017, I received $108,760.02 in a locked retirement account. Locked means I can’t add capital to the account, and growth is only generated through capital gains and dividends. I don’t report this portfolio’s results to brag about my returns or to suggest you follow my lead. My purpose has been solely to share with our members how I manage my portfolio with all the good and the bad that inevitably takes place each month. I hope you have learned and will continue to learn from my experiences managing this portfolio.
We Have a Valuation Problem
You know that I’m not a big fan of valuation models because they rely on assumptions. And you know what we say about assumptions…
However, I’m not blind either. In the past 30 years, the S&P 500 Shiller CAPE ratio has been at a higher level only once.
But first, the results!
Performance in Review
Let’s start with the numbers as of June 2nd, 2026 (before the bell):
Original amount invested in September 2017 (no additional capital added): $108,760.02.
- Current portfolio value: $337,629.57
- Dividends paid: $5,299.15 (TTM)
- Average yield: 1.57%
- 2025 performance: +7.34%
- VFV.TO= +12.18%, XIU.TO = +28.88%
- Dividend growth: +1.5%
Total return since inception (Sep 2017- June 2026): +210.44%
Annualized return (103 months): 14.11%
Vanguard S&P 500 Index ETF (VFV.TO) annualized return (since Sept 2017): 16.99% (total return 284.5%)
iShares S&P/TSX 60 ETF (XIU.TO) annualized return (since Sept 2017): 13.40% (total return 194.2%)
I don’t love valuation models because they rely on assumptions, and assumptions can be dangerous. But we still need to pay attention. Over the last three decades, the S&P 500’s Shiller CAPE ratio has been higher only one time.
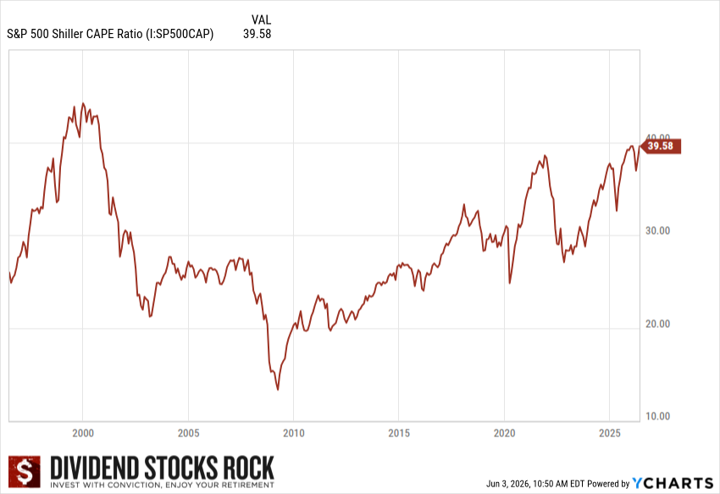
The Shiller CAPE ratio (Cyclically Adjusted Price-to-Earnings ratio) is a valuation measure for the U.S. stock market popularized by Nobel laureate economist Robert Shiller of Yale. It’s also called CAPE, P/E 10, or the Shiller P/E.
However, it’s not necessarily a reason to panic… not just yet anyway!
- It is a terrible short-term timing signal. The market can stay “expensive” for years or even a decade (the late 1990s and most of the 2010s–2020s are examples). High CAPE does not mean a crash is imminent.
- The “normal” level may have shifted upward. Critics argue structural changes justify a permanently higher CAPE: lower interest rates, changes in accounting rules (e.g., write-down treatment that depressed reported earnings around 2008–2009), higher profit margins, more buybacks, and a different sector mix (more high-margin tech, fewer capital-heavy industrials).
- It says nothing about individual stocks — it’s a whole-market measure.
However, it’s not a reassuring level to say the least.
But the following graph got me thinking a little further.
Last week, I did two podcast episodes about Canadian Banks (you can watch them below). While I covered their most recent earnings (which were excellent), I noticed something: Canadian banks’ dividend yields were abnormally low.
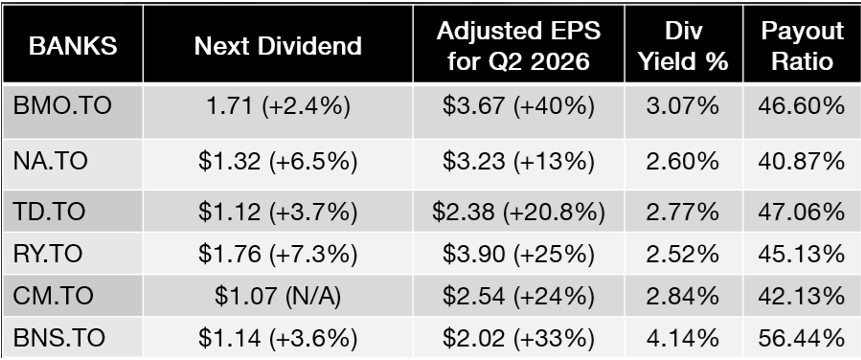
From the top of my memory, I couldn’t remember the last time I saw so many banks with a yield under 3%. 4 Banks now look like they are growth stocks and BMO is not too far behind at 3.07%.
The two metrics I like to use to see if a stock is overvalued is the PE Ratio and the dividend yield vs. their historic averages. For Canadian banks, I didn’t have to calculate the average yield over the past 5 years. They are all clearly offering their lowest yield in history!
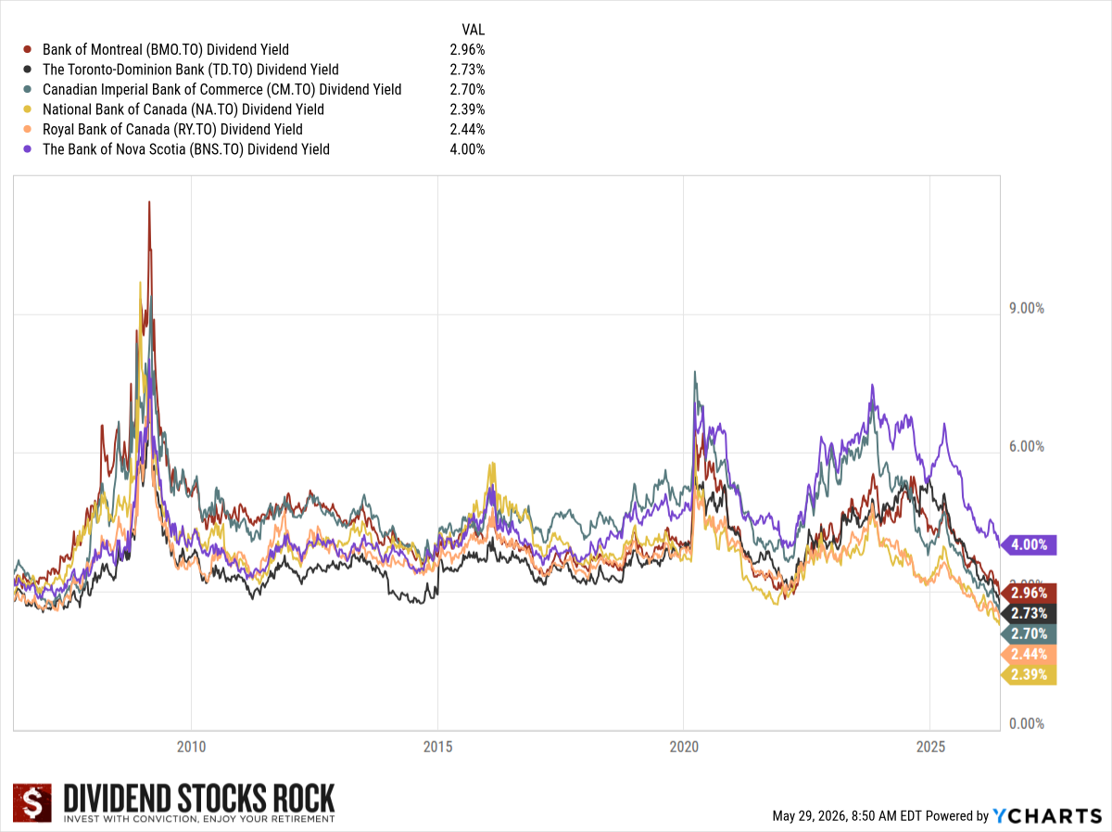
Those two graphs are saying pretty much the same thing: investors are paying a higher price than usual for stocks.
The real question is not whether the market is overpriced. The real question is:
Are investors changing their valuation perception?
Most of the time, Canadian banks trade around 11-13 times their earnings. The Forward PE (expected PE in 12 months) is now between 13 and 16! That means investors are paying a premium of 16/13 = 23% on banks like Royal Bank, TD Bank and National Bank.
On the other side, the Canadian bank business model has greatly evolved over the past 20 years:
- Expansion in the U.S. or internationally
- Massive growth of their wealth management business segment
- Massive growth of their capital markets business segment
- Banks are not just savings and loans anymore
Since banks are not what they used to be, it’s only normal to review what price we should be paying. Ironically, you will spend hours trying to find companies growing with high-single to double-digit numbers and still trading under a PE of 20 across the rest of the market.
Maybe a shift is happening in pricing, and it’s not just banks.
Priced for perfection
We see a lot of companies trading above 30 times their earnings. I often use the expression “priced for perfection”. This means investors expect companies not only to grow their revenue, earnings and cash flow by double-digits, but they also expect them to beat estimates like we expect Aaron Judge to hit a homerun every game, or Cole Caufield to score on a Saturday night.
When it doesn’t happen, the stock gets heavily punished. A good example is Microsoft. In the past 2 years, the stock is pretty much flat (+2.85% as of the beginning of June). However, MSFT’s revenue exploded by 30% and its EPS jumped by 40%.
In the last 12 months, the stock is down 8% while revenue is up 13% and EPS up 20.5%.
That is exactly what happens when a stock is priced for perfection.
What to make of it?
Good question, right?
At this point, I want to raise the question, but I don’t necessarily have a clear answer. I see too many pieces moving at the same time to determine if we are on the edge of a bear market or the edge of another strong bull run driven by efficiency.
I wish I had a clear answer to give you today, but I don’t. The market is clearly expecting a lot from companies right now, and that could lead to serious problems.
More than ever, the focus on quality companies that can withstand a massive crisis is central to my strategy. I certainly don’t want to make any wild guesses at this point.
Smith Manoeuvre Update
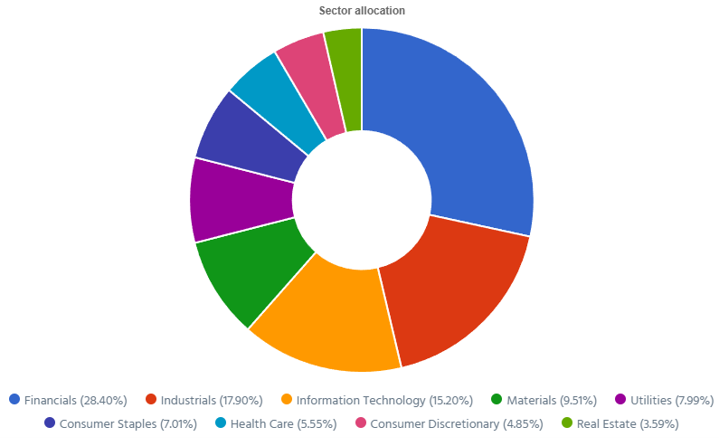
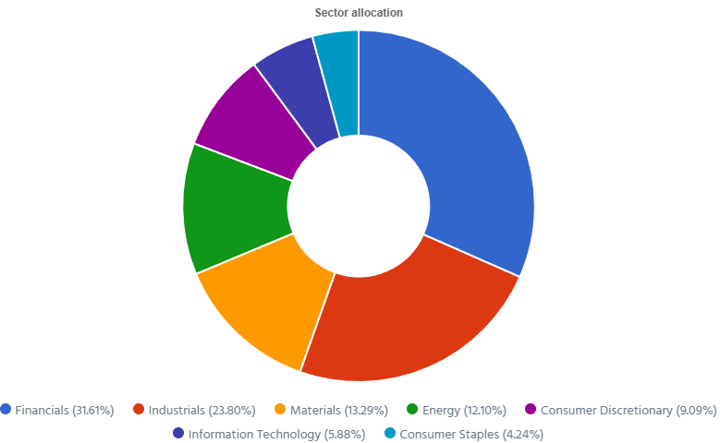
The portfolio shows 13 companies spread across 8 sectors. My goal is to build a portfolio of thriving companies with a solid dividend triangle (e.g. with positive revenue, EPS and dividend growth trends). The current portfolio yield is at 1.91% with a 5-year CAGR dividend growth rate of 12.24%.
- The portfolio value is now at $36,839.47.
- The portfolio debt is at $28,000.
- Interest paid since April 2022: $2,431.58.
- Monthly contribution is set at $1,000/month.
- The annual income is $704.84, and the projected income is $791.13.
- To report my Smith Manoeuvre, I export the Excel data from my DSR PRO dashboard.
The portfolio is on its way towards generating an extra $1,000 per year in dividends. I’m not there yet, but it will happen in the first months of 2027! By then, my portfolio will be close to $50,000! That will be exciting to see a 13th influx of $1,000 to boost the portfolio further!
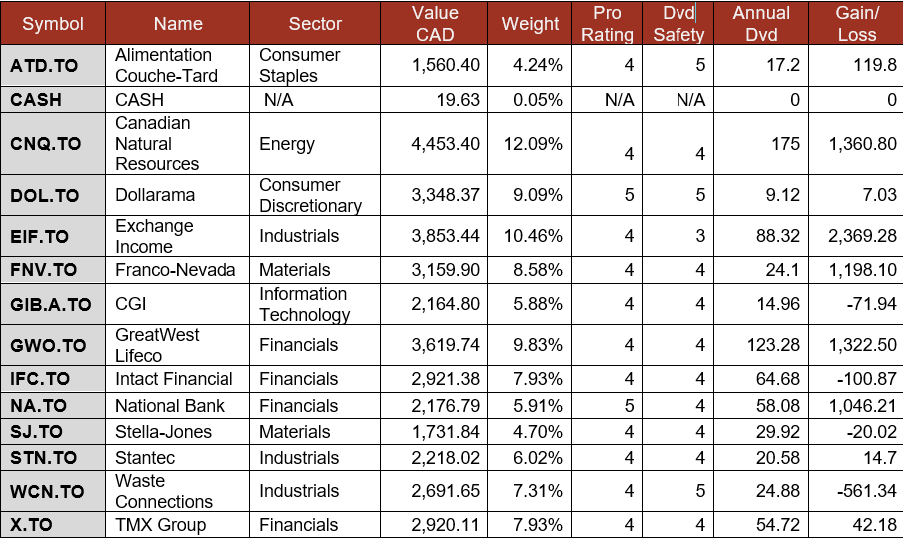
Smith Manoeuvre Portfolio Summary
Here’s my SM portfolio summary as of June 2nd, 2026 (before the bell):
Sold Brookfield Infrastructure, Bought Stantec
I sold my position in BIPC not because I don’t like the stock or that I’m spooked by recent movement, but rather in the optic of portfolio simplification. I didn’t hold BIPC anywhere else across all my accounts. Therefore, it was more of an “additional line” in my investment statement than it was a position playing a role in my portfolio.
By selling BIPC, I was able to add more Stantec at a depreciated price. I see this as a pretty good deal considering STN’s numbers aren’t slowing down while the price keeps on dropping. Its most recent quarter shows 9% revenue growth and 15% EPS growth. I will take that kind of results any day of the week!
I now have 33 positions across all my investments.
Pension Portfolio Summary
Here’s my pension plan portfolio summary as of June 2nd, 2026 (before the bell):
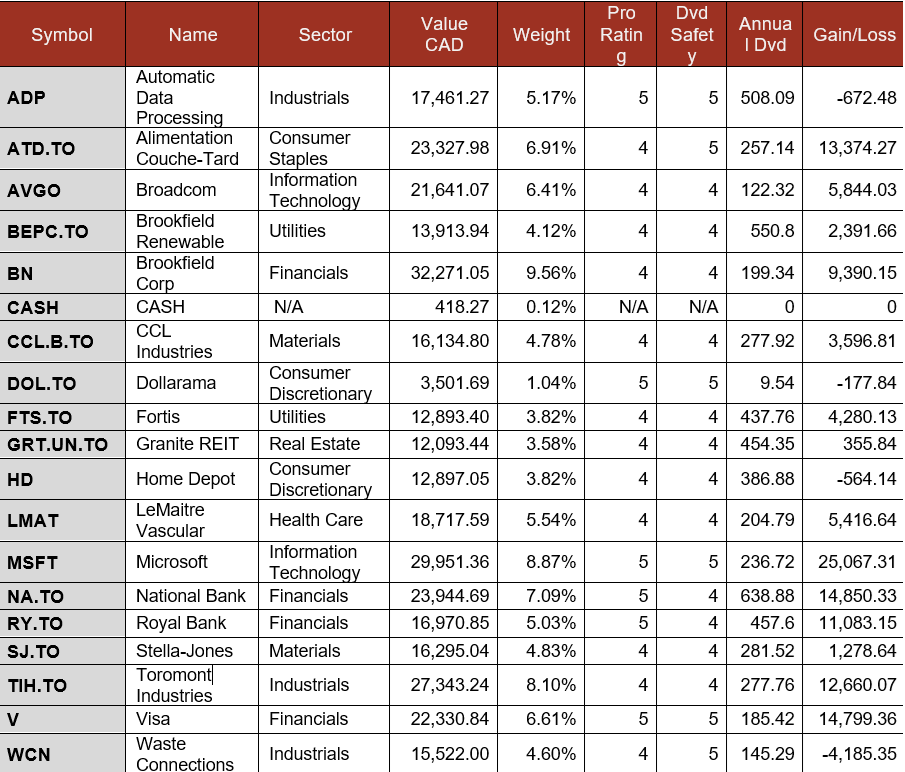
Total value: $337,629.57 (+$5,771.95, +1.74% from last month).
Broadcom was priced for perfection…
Broadcom reported a robust quarter with record revenue of $22.2B (+48%) and adjusted EPS was up 85%. AI semiconductor revenue surged 143% to $10.8B, representing 49% of total revenue. Infrastructure software revenue was $7.2B (+9%). Management attributed the outsized growth primarily to accelerating AI-related semiconductor demand, noting AI semiconductor revenue of $10.8 billion that grew 143% YoY, driven by custom AI accelerators and AI networking. Despite the beat, the stock fell approximately 15% on June 4 on guidance disappointment as there are growing fears that many AI companies (such as Alphabet) are working on reducing their reliance on chip makers such as AVGO.
Brookfield keeps on generating cash
Brookfield Corporation reported a strong quarter with distributable earnings before realizations up 7% to $0.59/share and total DE of $0.66/share. Asset management led with DE of $765M and fee-bearing capital growing 12% to $614B, while wealth solutions contributed $430M at a 15% ROE and operating businesses $360M. Revenue grew 4% to $18.6B and net income surged to $1.0B from $215M. BN repurchased $470M of its own shares year-to-date at $41 average, a 38% discount to management’s $66 intrinsic value estimate, with $188B in deployable capital available. The BN-BNT merger is on track to close by year-end, combining $145B in permanent insurance capital with the platform.
CCL Industries shows good results from CCL and Avery segments
CCL Industries reported a good quarter with revenue up 2.8% to CAD $1.94B and adjusted EPS up 1.7% to $1.20. Growth was led by the CCL segment (+4.3%, organic +3.1%) and Avery (+4.3%, organic +2.4%), while Checkpoint was essentially flat (-0.2%) and Innovia declined 5.5% on volume weakness in the U.K. and Australia. An equipment outage at the Pennsylvania aluminum container facility constrained capacity for much of the quarter. Input cost inflation in resins and aluminum is being managed through supply chain levers and customer pass-throughs. CCL closed the quarter at 0.85x leverage with $999M cash, and the Sleever acquisition is expected to close in June 2026.
Home Depot is building slowly
Home Depot reported a decent Q1 FY2026 with revenue up 4.8% to $41.8B and adjusted EPS of $3.43, down 4%. Results were driven by the SRS Distribution acquisition adding incremental revenue, a 2.3% increase in average ticket size to $92.76, and continued strength in the Pro contractor segment. Comparable sales grew 0.6% overall (US +0.4%), reflecting stable underlying demand offset by a 1.3% decline in transaction count as consumers remained cautious on large discretionary projects. Gross margin contracted 75bps to 33.0% on higher acquisition-related costs. Management reaffirmed FY2026 guidance of total sales growth of 2.5-4.5% and flat to +2.0% comparable sales growth.
National Bank disappoints (WHAT???)
National Bank reported a good quarter with EPS up 13%, but it was the weakest performance of all 6 major Canadian banks!
Personal & Commercial was up 18%, driven by the growth in loan and deposit volumes, lower PCLs, but partly offset by a lower net interest margin. PCLs were down $257M, mainly due to initial PCLs of $230M on acquired non-impaired CWB loans recorded in 2025. Wealth was up 18%, driven by growth in all types of revenues, mainly fee-based revenues. Capital Markets was down 3%, mainly due to a decrease in global markets’ revenues, partly offset by an increase in corporate and investment banking revenues. U.S. & Intl was up 10%, driven by a strong performance from ABA bank and lower PCLs. NA increased its dividend by 6%!
Here is a video about National Bank’s disappointing quarter:
Royal Bank stays the king of banks
RY reported a robust quarter with EPS up 25%. By segment: Personal Banking was up 17%, primarily driven by higher net interest income reflecting average volume growth of 2% and higher spreads. Commercial Banking was up 43%, primarily driven by lower PCL. Last year, PCLs increased significantly due to tariff concerns. Wealth moved up 28% due to higher fee-based client assets reflecting market appreciation and net sales. Insurance was up 3% and Capital Markets were up 23%, driven by higher revenues in Global Markets and Corporate & Investment Banking. PCLs of $912M decreased $512M (36%). RY increased its dividend by 7%!
Here is a video about Royal Bank’s Q2 earnings:
My Entire Portfolio Updated for Q1 2026
Each quarter we run an exclusive report for Dividend Stocks Rock (DSR) members who subscribe to our very special additional service called DSR PRO. The PRO report includes a summary of each company’s earnings report for the period. We have been doing this for an entire year now and I wanted to share my own DSR PRO report for this portfolio. You can download the full PDF showing all the information about all my holdings. Results have been updated as of April 7th, 2026. Next quarterly report will be available in July.
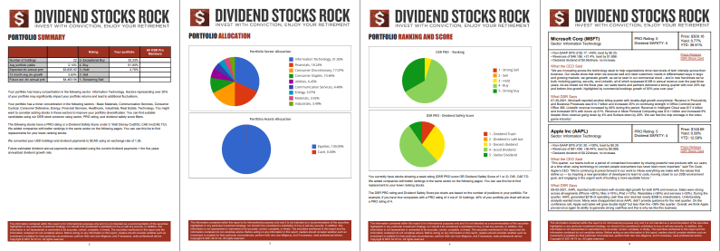
Download my portfolio Q1 2026 report.
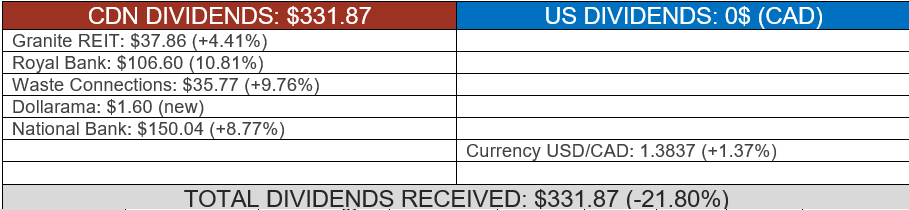
Dividend Income: $331.87 (-21.80% VS. May 2025)
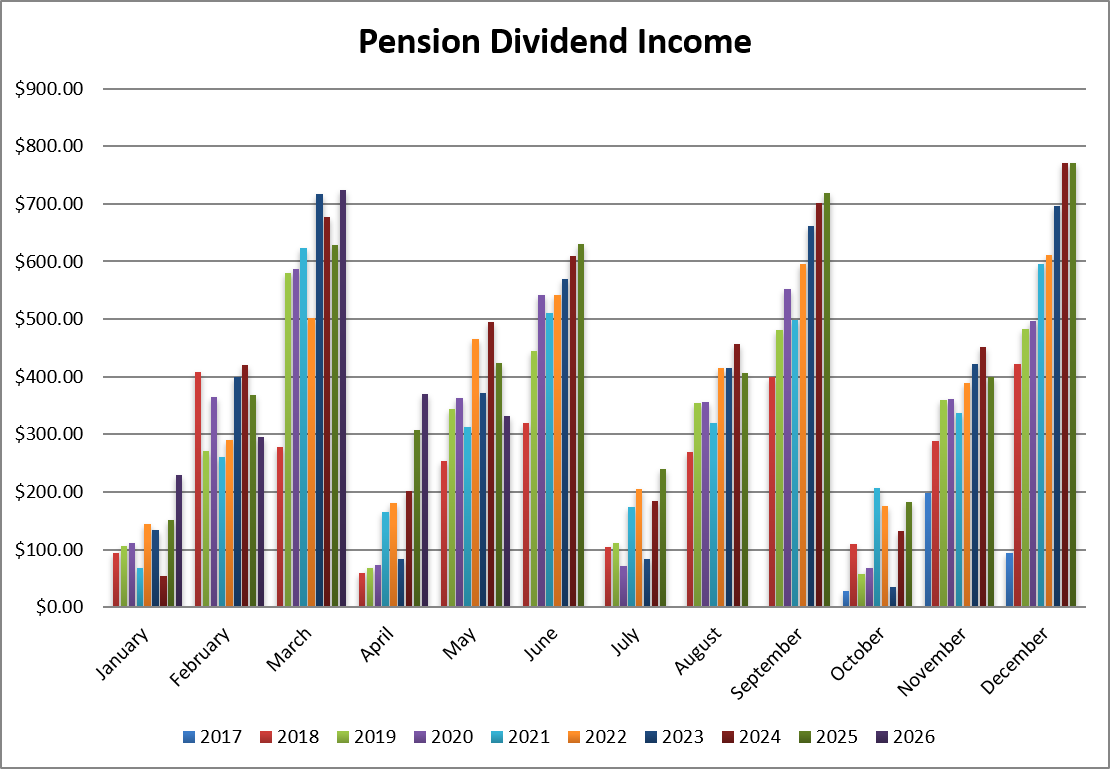
We can see a drop this month as I sold my Starbucks and Apple shares (that used to pay this month), and the dividend from LeMaitre Vascular will be paid in June this year.
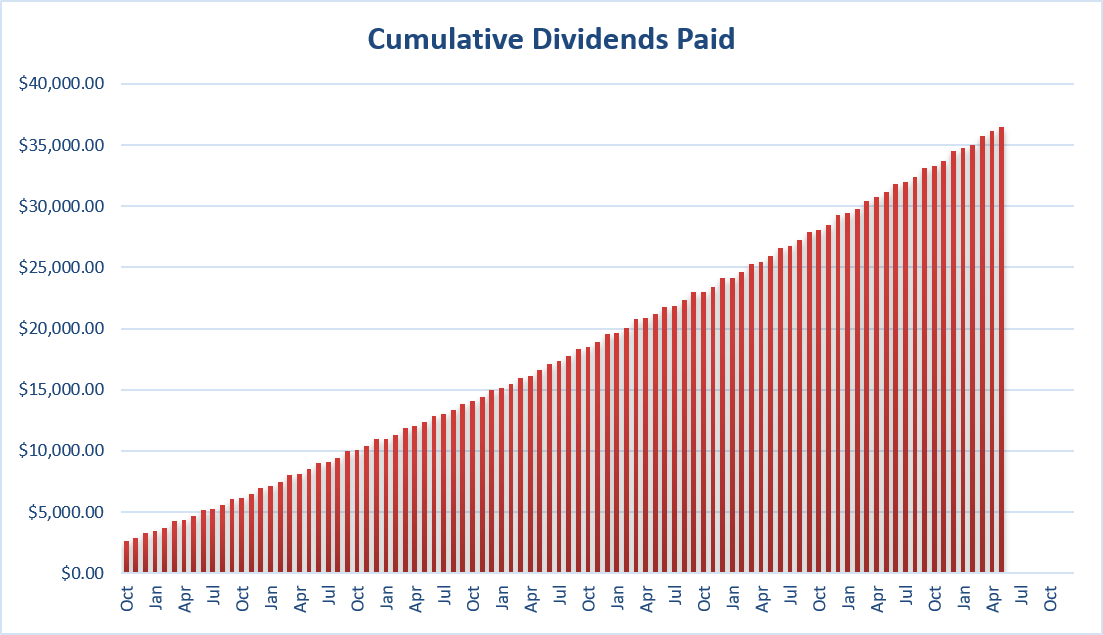
Since I started this portfolio in September 2017, I have received a total of $36,444.54 CAD in dividends. Keep in mind that this is a “pure dividend growth portfolio” as no capital can be added to this account other than retained and/or reinvested dividends. Therefore, all dividend growth is coming from the stocks and not from any additional capital being added to the account.
Final Thoughts
Watching my dividend grow is easing my concerns about the stock market valuation. After all, it’s not the first time I’ve seen the market as being “expensive”. And yet, my dividends keep growing and so do my portfolio values.
Ironically, what was “the end of the world” in 2008 is now just a small blip on a graph, and most people have forgotten what it was like during that “dark time”.
Cheers,
Mike.


Leave a Reply