
In September of 2017, I received slightly over $100K from my former employer, representing the commuted value of my pension plan. I decided to invest 100% of this money in dividend growth stocks.
Each month, I publish my results on those investments. I don’t do this to brag. I do this to show my readers that it is possible to build a lasting portfolio during all market conditions. Some months we might appear to underperform, but you must trust the process over the long term to evaluate our performance more accurately.
In this edition, I also explain how I determine whether its time to sell a stock.
Performance in Review
Let’s start with the numbers as of June 4th 2024 (before the bell):
Original amount invested in September 2017 (no additional capital added): $108,760.02.
- Current portfolio value: $256,038.65
- Dividends paid: $4,731.79 (TTM)
- Average yield: 1.85%
- 2023 performance: +20.69%
- SPY= +26.19%, XIU.TO = +11.87%
- Dividend growth: +1.7%
Total return since inception (Sep 2017 – May 2024): 135.42%
Annualized return (since September 2017 – 81 months): 13.52%
SPDR® S&P 500 ETF Trust (SPY) annualized return (since Sept 2017): 13.76% (total return 138.80%)
iShares S&P/TSX 60 ETF (XIU.TO) annualized return (since Sept 2017): 9.34% (total return 82.69%)
When It’s Time to Let Go
“Is it time to sell yet?”
Ah! That’s probably the toughest question to answer for each investor. That dilemma of keeping a stock in the hope it will go up (or continue to do so) or selling it and moving on. We put so much time and energy into analyzing a company, it always sounds like a waste to let one go.
I’ve been transparent with you over the past few months about my diminishing love for Magna International (MG.TO / MGA). Once again, I’ve been a little too patient with one of my holdings. But just hold that thought for a moment as I will come back to the concept of being patient later. For now, let’s take a look at why I pulled the trigger on MG.TO and let it go.
The golden rule: the narrative must match financial metrics
The number one reason why I hate having a dilemma is not the fact that I’m hesitating between two options, but rather because I waste time and energy thinking about it. Since I’m obsessed with efficiency, knowing that I’m wasting my mental bandwidth on something that doesn’t deserve as much of my attention drives me crazy.
For that reason, I’ve established clear rules to let go quickly and move on. You already know those rules, but here’s a quick refresh:
- Must sell if my investment thesis doesn’t match the financial metrics.
- Must sell if there are no dividend increases or if there is a dividend cut.
- Must sell if a position becomes overweight in my portfolio (sector/stock weight).
In this case, rule number 1 applies: my investment thesis for Magna International is great, but numbers aren’t backing it up.
The story you tell yourself about a company is what will drive you to make the purchase. Based on your business model understanding and your financial metrics analysis, you will write down the reasons why you believe company ABC deserves a spot on your portfolio’s roster.
I have many reasons why I like Magna. The company operates a sticky business model with deep roots with several car makers across the world. MG is working hand in hand with car makers to make specific auto parts. That makes it very hard for the carmaker to get rid of MG as it would also get rid of all the time and dollars spent in R&D with its partner. MG specializes in parts of light weight vehicles and has also inked deals for many electric car parts.
As you can see, I have written a compelling narrative around why MG deserved a spot in my portfolio. That’s all great until you look at the numbers:
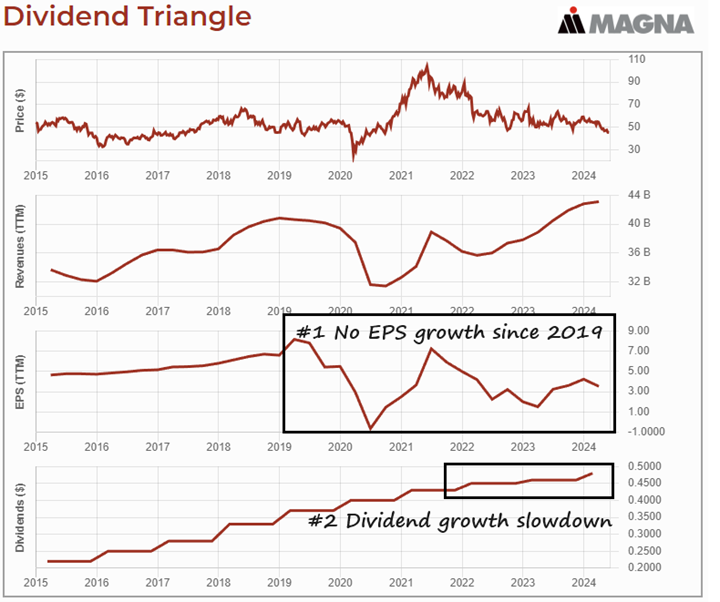
When I look at MG’s dividend triangle through DSR data, I see two major problems. The first one is while revenue recovered from COVID and continues to grow, MG’s EPS struggles. No growth since 2019 and the company continues to focus on cost-cutting initiatives to improve margins. Problem #2 is obviously linked to weaker earnings and it has led to weaker dividend growth as well. MG has reduced its dividend growth policy over the past two years. I consider it an intelligent move on the part of management (always prioritize the business’ health and future over dividends), but it’s a sign that things aren’t peachy.
Selling Magna International (MG.TO) to buy 47 shares of Toromont Industries (TIH.TO)
While I continue to like my investment thesis for Magna, it’s time to protect my portfolio from myself and let the good old rationale work its magic. Numbers are telling me I’m wrong. I must accept that.
Therefore, without further ado, I sold my shares of Magna and I will never look back. Taking off a “negative” line in my portfolio always feels good. Less time and energy on negative thoughts, more of them directed toward strong dividend growers.
I’ve been eyeing Toromont Industries for a while. TIH shows a very solid and well-diversified business model. In addition to counting on the mining (20%) and construction (38%) sectors to grow organically, the company also buys smaller dealerships, such as Hewitt (acquired in 2017). Considering the massive infrastructure spending needs in Canada for the coming years, Toromont is surely a player that could do well going forward.
TIH shows an interesting diversification with CIMCO representing 13% of its sales. The CIMCO segment is involved in the designing, engineering, fabrication, and installation of industrial and recreational refrigeration systems. Finally, TIH shows 35 consecutive years with a dividend increase.
Patience pays off… most of the time
I see patience as an essential skill for a successful investor. Without exhibiting patience, I would not show such a great run on the market. For that reason, I never chase news or earnings reports. I never trade on bad or great news that moves a stock by double-digits.
I never feel the urge or the rush to trade.
When a company is not showing the desired financial metrics (such as MG), I will show patience and take notes of the trend. I will try to understand what is going on by doing additional research and determine if it’s a short-term thing or the beginning of a long-term trend.
Throughout the years, this process enabled me to keep my shares of Apple when it was not doing that great, to double down on my investment in Alimentation Couche-Tard when everyone else was selling (2021), to keep my faith in National Bank, to show strong returns from BlackRock, Visa and Texas Instruments despite several fluctuations, etc.
From time to time, “being patient” has hurt my portfolio. Holding Sylogist (I could have taken a hefty profit), Andrew Peller, CAE, Disney, and now Magna International haven’t paid off.
On top of getting good results, I think that patience also has enabled me to sleep better at night and stress less about the noise going on in the stock market daily. Being able to ignore the noise is priceless. Following my investment process quarterly is so much easier and profitable than chasing news and acting swiftly!
Smith Manoeuvre Update
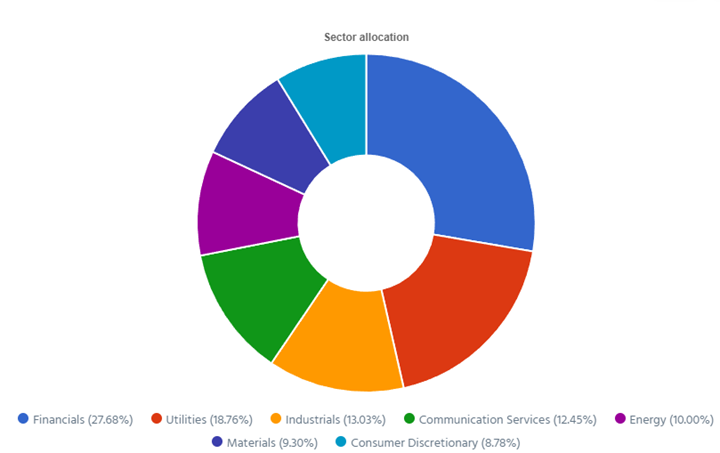
Slowly but surely, the portfolio is taking shape with 10 companies spread across 7 sectors. My goal is to build a portfolio generating 4-5% in yield across 15 positions. I will continue to add new stock monthly until I reach that goal. My current yield is 5.20%.
Buying more of what works (adding 5 shares of NA.TO @ $117.55)
Due to a lack of interesting companies offering a 4%+ yield, I decided to buy more of what really works: National Bank! NA is now offering a yield below 4%, but the bank is growing steadily. It shows a strong dividend triangle. While some other banks are struggling, NA has found a good balance between their classic banking activities (with growing provisions for credit losses) and growing outside of that business model.
Its performance in wealth management and capital markets is quite impressive and NA’s activities in the U.S. (Credigy) and Cambodia (ABA Bank) continue to pay off.
You can hear my take on National Bank’s possible acquisition on Canadian Western Bank (CWB) here:
Here’s my SM portfolio as of June 4th, 2024 (in the morning):
| Company Name | Ticker | Sector | Market Value |
| Brookfield Infrastructure | BIPC.TO | Utilities | $930.00 |
| Canadian National Resources | CNQ.TO | Energy | $1,058.09 |
| Capital Power | CPX.TO | Utilities | $1,128.39 |
| Canadian Tire | CTA.A.TO | Consumer Disc. | $977.41 |
| Exchange Income | EIF.TO | Industrials | $1,435.52 |
| Great-West Lifeco | GWO.TO | Financials | $696.32 |
| National Bank | NA.TO | Financials | $1,291.62 |
| Nutrien | NTR.TO | Materials | $1,017.12 |
| Telus | T.TO | Communications | $1,372.50 |
| TD Bank | TD.TO | Financials | $1,052.94 |
| Cash (Margin) | $0.06 | ||
| Total | $10,959.97 | ||
| Amount borrowed | -$10,500.00 |
Let’s look at my CDN portfolio. Numbers are as of June 4th, 2024 (before the bell):
Canadian Portfolio (CAD)
| Company Name | Ticker | Sector | Market Value |
| Alimentation Couche-Tard | ATD.B.TO | Cons. Staples | $23,794.42 |
| Brookfield Renewable | BEPC.TO | Utilities | $11,112.06 |
| CCL Industries | CCL.B.TO | Materials | $9,773.40 |
| Fortis | FTS.TO | Utilities | $9,300.69 |
| Granite REIT | GRT.UN.TO | Real Estate | $8,544.24 |
| National Bank | NA.TO | Financials | $14,181.20 |
| Royal Bank | RY.TO | Financial | $9,625.20 |
| Stella Jones | SJ.TO | Materials | $11,985.14 |
| Toromont Industries | TIH.TO | Industrials | $5,561.98 |
| Cash | $139.47 | ||
| Total | $104,027.80 |
My account shows a variation of +$14,069.60 (+4.07%) since the last income report on May 3rd.
Many Canadian companies reported their earnings as of late. Let’s do a quick review!
Brookfield Renewable is on a roll
Brookfield reported another solid quarter with distributable EPS up 7%. Asset management benefited from positive fundraising momentum and successful capital deployment across BN’s latest flagship funds and complementary strategies. Wealth Solutions delivered a significant increase in earnings from strong investment performance and continued growth in the business. Operating businesses generated stable cash flows, supported by the resilient earnings across BN’s renewable power and transition, infrastructure and private equity businesses, as well as 5% growth in same-store net operating income (“NOI”) from its core real estate portfolio.
CCL Industries shows double-digit EPS jump
CCL Industries reported a good quarter with revenue up 5% and EPS up 15%. Sales increased by 2% from organic growth and 3% from acquisitions. Sales by segments: CCL +8%, driven by high-single-digit sales in Asia. Avery -2.9%, hurt by the organic decline of -4.5%. Checkpoint +6.8%, driven by strong organic growth (+9.2%). Innovia -1.5% due to weaker organic sales (-3%). EPS increase was driven by stronger sales and margin improvements (up 60 basis points). There was also a restructuring charge (mainly comprised of severance costs associated with the CCL Design electronics business) in CCL’s 2023 financial statements.
Fortis is always on track
Fortis reported a good quarter with EPS up 2%. This growth was attributed to rate-based growth across the company’s utilities and favorable timing of earnings from new cost-to-capital parameters at FortisBC. Fortis also reiterated its confidence in its dividend policy, forecasting a 4%-6% annual dividend growth through 2028, highlighting the company’s commitment to delivering shareholder value consistently. Fortis is progressing well with its $4.8 billion capital plan for 2024, part of a larger five-year plan totaling $25 billion which is focused predominantly on regulated investments.
Granite REIT keeps on rocking
It was business as usual at Granite for this quarter as revenue increased by 7% and AFFO per unit increased by 3%. The AFFO payout ratio for the quarter is 67% compared to 68% last year. The occupancy rate remains stable at 95% vs. 95.4% last year. During the quarter, Granite signed a lease for 124,500 square feet of one of its recently developed properties in Lebanon, Tennessee, commencing in June 2024 for a 5.3-year term. Granite’s forecast for FFO/unit remains unchanged at $5.30 to $5.45 (AFFO/unit expectations were down by $0.05 to $4.60 to $4.75) due to higher capital expenditures.
National Bank is a beast (oh please, tell me you know now!)
National Bank reported a solid quarter compared to its peers. Revenue was up 4% and EPS was up 9%. Results were driven by good performance in all of the business segments, partly offset by higher non-interest expenses, higher provisions for credit losses, and the impact of the Canadian government’s 2022 tax measures recorded in the first half of 2023. PCL went from $85M in 2023 to $138M this year. It’s still a metric to follow carefully. By segment: P&C +3%, Wealth +15%, Financial Markets +20%, US & Intl +27%. The bank also raised its dividend by 4% which deserves a “well done” from all its shareholders.
Royal Bank did better than most
Royal Bank did better than the rest of the Big 5 with revenue up 14% and EPS up 9%. The bank completed the acquisitions of the HSBC Canadian assets, which boosted revenues, but partially hurt EPS. Total PCL increased $320M from a year ago. The PCL on loans ratio of 41 bps increased 11 bps from the prior year. The PCL on impaired loans ratio was 30 bps, up 9 bps. Results by segment: P&C: +7%, Wealth +7%, Insurance +4% and Capital Markets +31% (driven by strong M&A activities). RY announced a 2.9% dividend increase along with a share buyback program to retire 30 million shares.
I reviewed all Canadian banks most recent earnings in this video below. Get more details on the Scotiabank (BNS) failure!
Stella Jones’s results are driven by organic growth
Stella-Jones reported another solid quarter with revenue up 9% and EPS up 32%. Excluding the contribution from acquisitions, sales were up $51M, or 7%. The increase was driven by a 10% organic sales growth of the Company’s infrastructure businesses (utility poles, railway ties and industrial products). All infrastructure product categories benefited from higher sales prices, while residential lumber sales were unfavorably impacted by the decrease in the market price of lumber this year.
Toromont Industries disappoints, that’s why I’m adding it!
Toromont Industries reported disappointing numbers as revenue declined by 3% and EPS dropped by 13%. Revenue decreased in the Equipment Group 3% and increased at CIMCO 3% compared to Q1 of 2023. Lower revenue in the Equipment Group resulted from lower equipment deliveries, on delays in customer schedules as well as against a stronger comparable last year. The decrease in earnings reflects the lower revenue, higher relative expenses and lower gross margins. However, bookings increased 62%, driven by several large orders in mining and construction. The current backlog went from $1.1B last year to $1.4B.
Here’s my US portfolio now. Numbers are as of June 4th, 2024 (before the bell):
U.S. Portfolio (USD)
| Company Name | Ticker | Sector | Market Value |
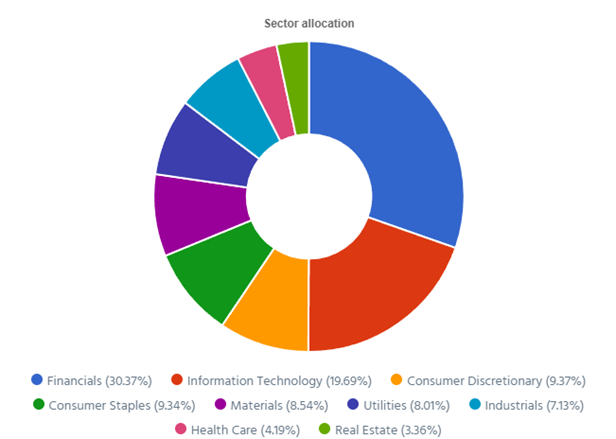
| Apple | AAPL | Inf. Technology | $7,761.20 |
| Automatic Data Processing | ADP | Industrials | $9,272.76 |
| BlackRock | BLK | Financials | $10,883.18 |
| Brookfield Corp. | BN | Financials | $14,985.67 |
| Home Depot | HD | Cons. Discret. | $9,840.30 |
| LeMaitre Vascular | LMAT | Healthcare | $7,855.00 |
| Microsoft | MSFT | Inf. Technology | $19,435.44 |
| Starbucks | SBUX | Cons. Discret. | $7,715.52 |
| Texas Instruments | TXN | Inf. Technology | $9,686.00 |
| Visa | V | Financials | $13,519.00 |
| Cash | $181.22 | ||
| Total | $111,135.29 |
My account shows a variation of +$5,461.06 (+5.17%) since the last income report on May 3rd.
Brookfield is amazing
BN reported another solid quarter with distributable EPS up 7%. Asset management benefited from positive fundraising momentum and successful capital deployment across BN’s latest flagship funds and complementary strategies. Wealth Solutions delivered a significant increase in earnings from strong investment performance and continued growth in the business. Operating businesses generated stable cash flows, supported by the resilient earnings across BN’s renewable power and transition, infrastructure, and private equity businesses, as well as 5% growth in same-store net operating income (“NOI”) from its core real estate portfolio.
Home Depot gets hit by the economy’s slowdown
It wasn’t the best quarter for HD as the company reported declining sales (-2.2%) and EPS (-5%). Comparable sales decreased 2.8% as customer transactions were down 1.0% and the average ticket was also down 1.3%. The quarter was impacted by a delayed start to spring and continued softness in certain larger discretionary projects. Once again, we feel the weight of an economic slowdown on HD’s results. Looking ahead, Home Depot expects comparable sales to decline approximately 1.0% in FY24. The home improvement retailer expects to open approximately 12 new stores during this year.
My Entire Portfolio Updated for Q1 2024
Each quarter we run an exclusive report for Dividend Stocks Rock (DSR) members who subscribe to our very special additional service called DSR PRO. The PRO report includes a summary of each company’s earnings report for the period. We have been doing this for an entire year now and I wanted to share my own DSR PRO report for this portfolio. You can download the full PDF showing all the information about all my holdings. Results have been updated as of January 10th, 2024.
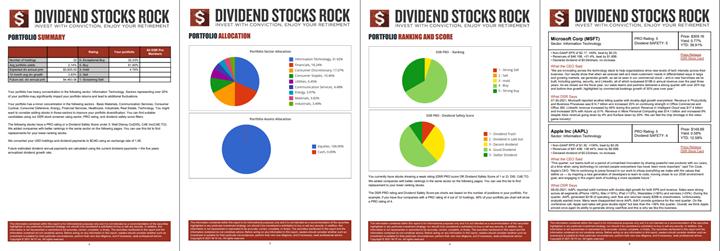
Download my portfolio Q1 2024 report.
Dividend Income: $495.73 CAD (+33.49% vs May 2023)
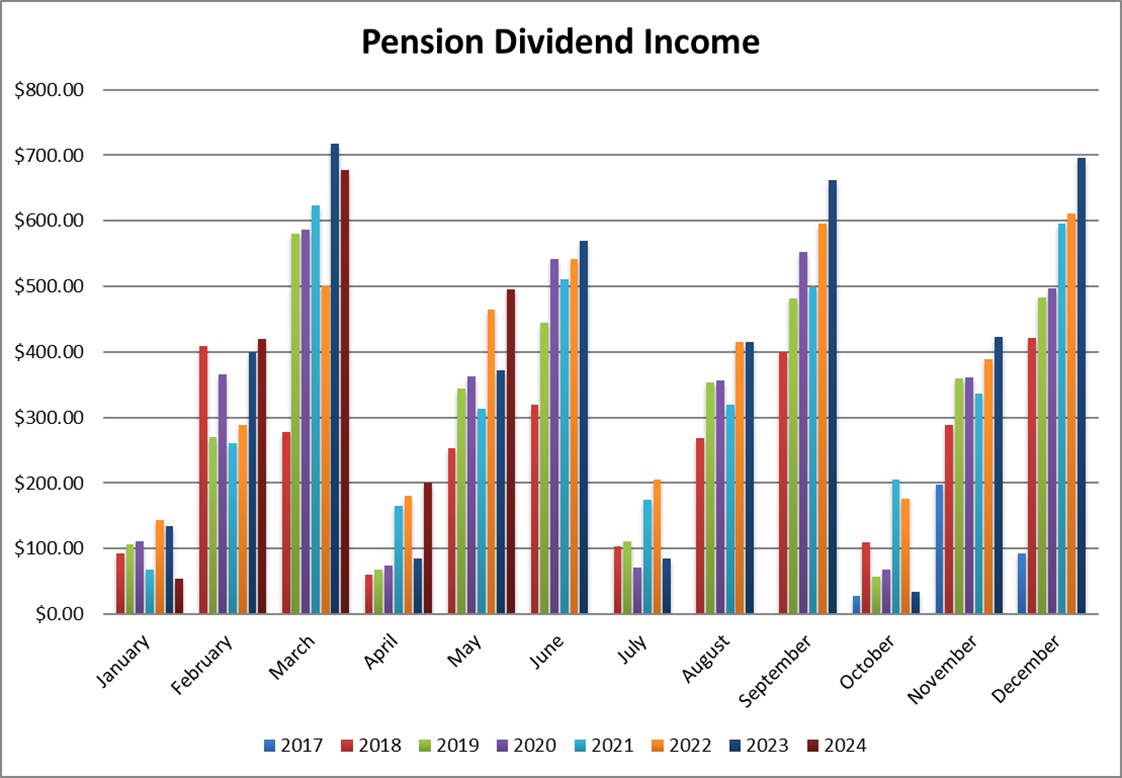
This month, I have many holdings showing an improvement in their dividend payment vs last year. National Bank is leading the way with a 9% increase. Magna International paid its last dividend in my portfolio in May while it was recorded in April last year. Finally, Lemaitre vascular is a new dividend payer this month with a modest contribution of $16 USD.
Dividend growth (over the past 12 months):
- National Bank: +9.28%
- Granite: +3.10%
- Royal Bank: +4.55%
- Magna Intl: was paid last month
- Apple: -44.4% (I sold some shares)
- Texas Instruments: +4.84%
- LeMaitre Vascular: new
- Starbucks: +18.93%
- Currency: +2.27%
Canadian Holding payouts: $297.97 CAD.
- National Bank: $128.26
- Granite: $35.20
- Royal Bank: $89.70
- Magna Intl: $44.81
U.S. Holding payouts: $144.58 USD.
- Apple: $10.00
- Texas Instruments: $65.00
- LeMaitre Vascular: $16.00
- Starbucks: $53.58
Total payouts: $495.73 CAD.
*I used a USD/CAD conversion rate of 1.3678
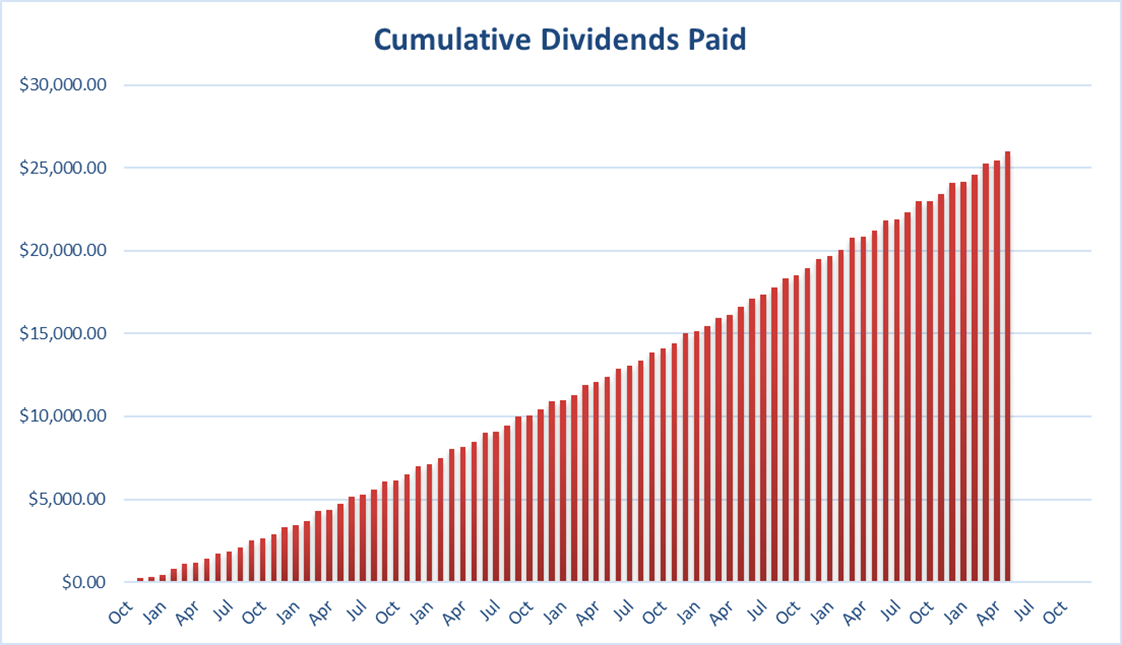
Since I started this portfolio in September 2017, I have received a total of $25,960.82 CAD in dividends. Keep in mind that this is a “pure dividend growth portfolio” as no capital can be added to this account other than retained and/or reinvested dividends. Therefore, all dividend growth is coming from the stocks and not from any additional capital being added to the account.
Final Thoughts
I’m glad I finally sold my investment in Magna and moved on to Toromont. At this point, I have a small position in TIH and I can already tell you that future dividends and potential trimming sales proceeds will go to bolster that position in the coming years.
Once again, life is always easier when I follow my investment process. There is a reason why we set investment rules.
Cheers,
Mike.


Leave a Reply