
A member asked me this during a private webinar at Dividend Stocks Rock, and I have not stopped thinking about it since.
I know how to compare two stocks. I know how to look at metrics. But how do I pick the right company when the two companies I am looking at are both amazing?
That is a better question than it sounds. Most investing content teaches you to tell a good company from a bad one. Almost nobody tells you what to do when both pass every test you know how to run.
So I picked the hardest example in my own portfolio. Royal Bank and National Bank. Two Canadian banks I own, both with a strong dividend triangle, both very hard to fault.
I pulled them up side by side and tried to answer honestly.
I could not pick.
That is not a cop-out. It is the most useful thing I can tell you about comparing two great businesses. Sometimes the numbers will not break the tie, and you need a second method ready for when that happens.
*Disclosure: I own National Bank (NA) and Royal Bank (RY). This is education, not advice. Do your own due diligence.*
Royal Bank vs National Bank: Which One Should You Buy?
On today’s numbers, both. Royal Bank and National Bank are nearly identical on yield, payout ratio and valuation, so the decision comes down to which investment thesis you prefer, not which metric reads higher.
My process never changes. Numbers first, story second. I do not want to read the investment thesis early, because I do not want to fall in love with a company before I have looked at the hard facts. Numbers are hard facts. A story is a story.
Here is where the two banks sit today, in Canadian dollars, with market data as of August 7, 2026.
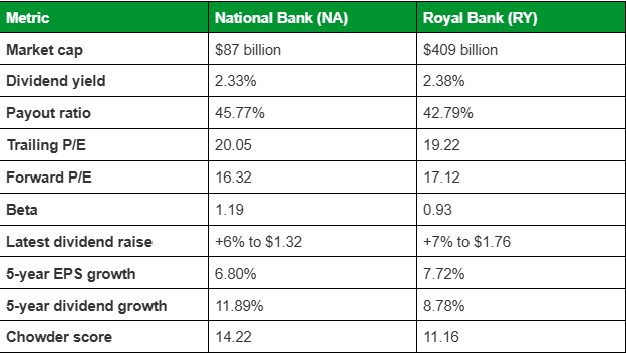
Now look at that table and try to pick a winner.
- Yield: five basis points apart, 2.33% against 2.38%.
- Payout ratio: 45.77% against 42.79%, both right where a healthy Canadian bank should sit.
- Trailing P/E favours Royal Bank, 19.22 against 20.05.
- Forward P/E reverses it, 16.32 for National Bank against 17.12.
- The two valuation metrics point in opposite directions and cancel each other out.
- The earnings leg is just as tight. Royal Bank has compounded earnings per share at 7.72% a year over five years, National Bank at 6.80%. Less than a point separates them.
Two differences are real. National Bank is the more volatile of the two, with a beta of 1.19 against 0.93. And National Bank has grown its dividend much faster, 11.89% a year against 8.78%, which is what lifts its Chowder score to 14.22 against 11.16.
Calmer ride, or faster-growing income. That is a preference. It is not a decision.
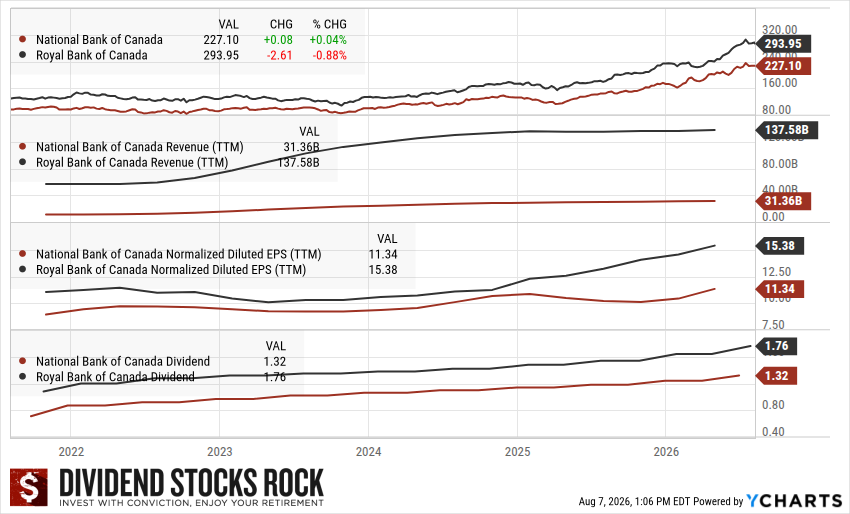
One note on revenue. I skip it for banks. Revenue moves with rates, trading activity and acquisitions, and it tells you very little about the health of the business. Earnings and dividends carry the weight here.
What Do You Do When Two Stocks Tie on the Numbers?
Stop looking for a metric to break the tie. Go to the investment thesis instead.
The mistake I watch investors make at exactly this moment is to keep digging for a number that will decide it for them. Chowder score. PEG ratio. Something obscure they have never used before. They are not analyzing anymore. They are looking for permission.
When two companies are this close, the differentiators live outside the spreadsheet. Here is where I actually look.
Who is the leader? If scale and market leadership matter to you, this is a clear Royal Bank win. It is the largest company on the TSX at $412 billion, nearly five times National Bank’s size.
Where is the growth coming from? Royal Bank is far more present in the United States, and diversified through capital markets and wealth management. National Bank is heavy on capital markets and wealth too, but far more concentrated in Canada, with a small US presence and a growing operation in Cambodia through ABA Bank.
Does the company grow by acquisition? Both do, so this one does not help. Royal Bank bought HSBC Canada. National Bank bought Canadian Western Bank, and Laurentian Bank assets before that.
What are those acquisitions actually buying? This is the most interesting one. National Bank’s strategy is to buy client books that feed wealth management. Canadian Western came with roughly $37 billion in loans and a large book of commercial clients who had no private banking relationship. When those business owners eventually sell, they will be looking for advice, and National Bank intends to be there. Royal Bank, being much larger, plays hardball everywhere at once.
What risk are you actually taking? National Bank is more exposed to Quebec’s economy. Royal Bank carries a large mortgage portfolio across all of Canada, and in a genuine mortgage crisis it likely takes the bigger hit. Neither of those is a flaw. They are different bets, and you should know which one you are making.
None of that appears on a screener. All of it is a legitimate basis for a decision.
Should You Just Buy Both?
Often, yes. When two companies both show a strong dividend triangle, owning both is a perfectly good answer, and it is the one I chose.
There are three honest ways out of this, in the order they usually apply.
Buy both. There is no rule that says you must choose. Two strong businesses, two strong triangles, two positions.
Pick one characteristic and let it decide. If you already hold a bank and do not want a third, choose the trait you genuinely prefer and stop. Lower volatility and market leadership point to Royal Bank. Faster dividend growth and more room to compound from a smaller base point to National Bank. Both are defensible. Neither is wrong.
Watch for the duplicate trap. The lazy version of buy both is how portfolios end up holding Visa and Mastercard, Royal and National, Fortis and Hydro One, and forty positions that all do the same job. Expanding your portfolio is not the same as making a decision. If you are buying both because you cannot choose, at least be honest that that is what is happening.
How I Compare Two Stocks, Step by Step
Numbers first, thesis second, always in that order.
I start with the stock comparison tool and let the numbers speak. The dividend triangle, the payout ratio, the valuation. At that stage I do not care about the story, because I do not want to fall in love with one company before the facts are in.
Only then do I read the investment thesis, the risk potential and the dividend growth perspective. That is where I learn what the business actually is, and that is where a tie gets broken.
If the numbers disqualify a company, I am done, and no story rescues it. If the numbers say both are strong, I have already won. At that point I am not choosing between a good company and a bad one. I am choosing between two good ones, and the cost of picking wrong is small.
That is the answer to the member’s question. You do not need conviction that one is better. You need conviction that both clear the bar, and then permission to stop optimizing.
Want a Shortlist of Companies That Clear the Bar?
Finding businesses with a strong dividend triangle is the hard part. Screening 1,100 stocks by hand is not how I want to spend a Sunday, and I doubt you do either.
The Dividend Rock Star List narrows the field for you. It is updated every month and shows 250+ dividend growers with solid metrics and robust business models. Treat it as a starting point for your research, not a shopping list.
Enter your name and email below, and I will send it straight to your mailbox.







I appreciate your investment guidance. Also I trust it. It has allowed me over many years to become more informed and to do my own trading.
Unable to open the list. What is the format?
It is an .xls (Excel) file.