

In 2016, I made a life-changing decision: I took a sabbatical, put my family in a small RV, and we drove all the way to Costa Rica.
Upon my return in 2017, I officially quit my job as a private banker at National Bank and started working full-time on my baby: Dividend Stocks Rock. I also decided to manage my pension account held at the National Bank. I’ve built and managed this portfolio publicly since 2017 to create and track a real-life case study.
In August 2017, I received $108,760.02 in a locked retirement account. Locked means I can’t add capital to the account, and growth is only generated through capital gains and dividends. I don’t report this portfolio’s results to brag about my returns or to suggest you follow my lead. My purpose has been solely to share with our members how I manage my portfolio with all the good and the bad that inevitably takes place each month. I hope you have learned and will continue to learn from my experiences managing this portfolio.
Q1 2026 In Review
I’ve been fully invested in stocks since 2003, and the market never ceases to amaze me. When you ask me what I think will happen “this year” or what will be the best sector to invest in, I always answer the same way:
Your guess is as good as mine
You know why? Because we never know what will happen next!
Once again, the stock market confirms that I am right. There is no point in trying to figure out what will happen over the next 12 months.
But first, the results!
Performance in Review
Let’s start with the numbers as of April 6th, 2026 (before the bell):
Original amount invested in September 2017 (no additional capital added): $108,760.02.
- Current portfolio value: $321,406.88
- Dividends paid: $5,329.86 (TTM)
- Average yield: 1.66%
- 2025 performance: +7.34%
- VFV.TO= +12.18%, XIU.TO = +28.88%
- Dividend growth: +1.5%
Total return since inception (Sep 2017- November 2025): +195.52%
Annualized return (101 months): 13.74%
Vanguard S&P 500 Index ETF (VFV.TO) annualized return (since Sept 2017): 15.41% (total return 234.0%)
iShares S&P/TSX 60 ETF (XIU.TO) annualized return (since Sept 2017): 12.97% (total return 179.20%)
When I wrote my investment theme newsletter at the end of 2025, I discussed AI as a macro play, energy (to fuel AI), massive CAPEX driving the bull market, private equity and gold. I didn’t forecast the surprise capture of Nicola Maduro, Venezuela’s President. I was far from telling you a war was imminent in Iran!
Most importantly, I didn’t talk about Iran’s opposition and its move to block the Strait of Hormuz.
All of this is creating tons of noise, leading to skyrocketing energy prices along with the fear of having a helium shortage.
Did you know that about a third of the world’s commercial helium supply is typically transported through the Strait of Hormuz, largely originating from Qatar’s production facilities?
Did you know that we need helium to support the creation of irreplaceable coolants that make MRI scanners and advanced microchips possible?
You can see now why there is so much volatility!
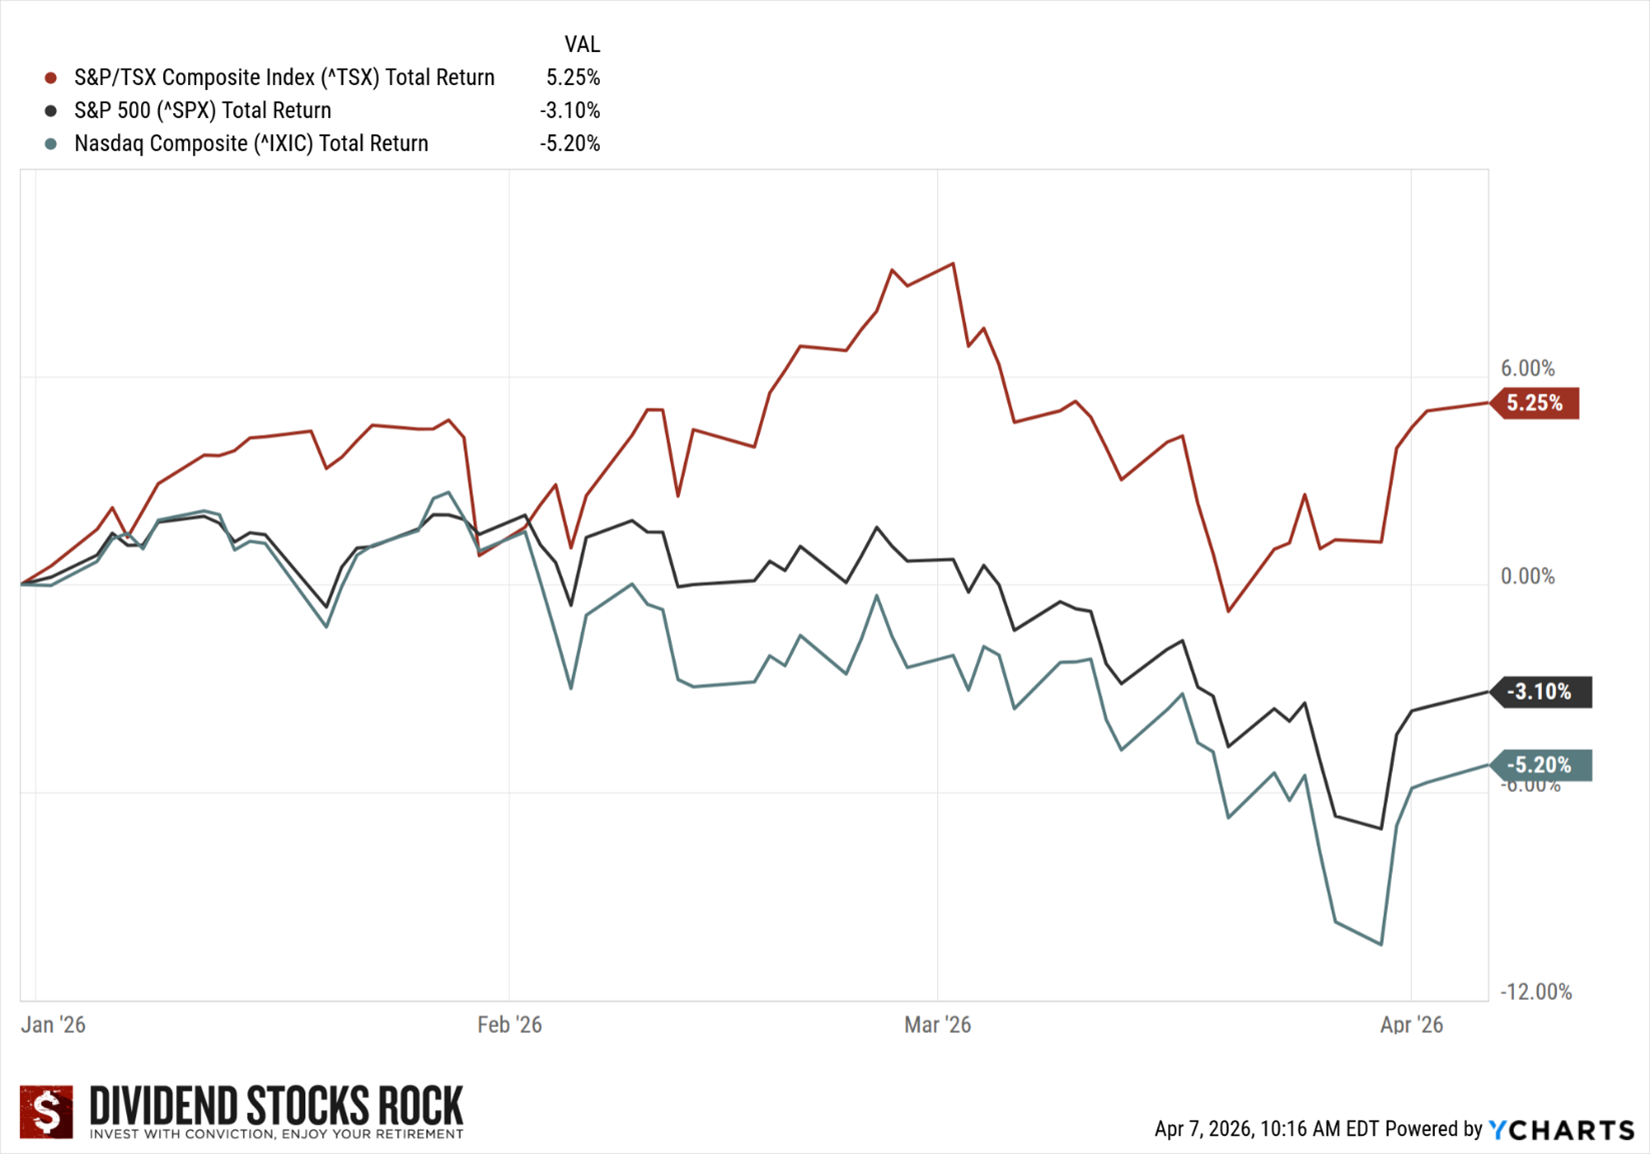
So, we now wake up in early April with the Canadian market outperforming the S&P 500 and the Nasdaq. There is a feeling of déjà vu as this is what happened in 2025. Last year it was gold; this year its oil driving the market.
What Performed so Far in 2026?
Last year, gold investors were quite proud of their portfolios. They were right as gold, silver and other metals created impressive returns. Then, I started to see more questions about how to buy metals.
- Should I store it? At home or with a firm?
- Is investing in ETFs the same thing?
- Should I go for mining stocks or streamers?
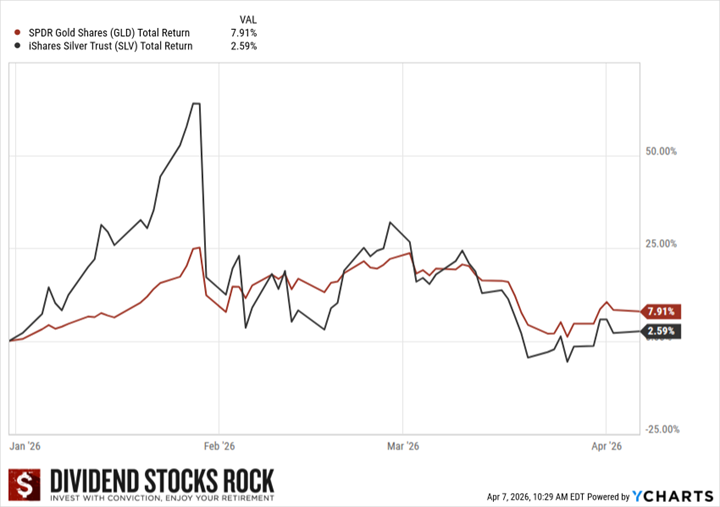
In January, we saw silver jump by 60% and gold break $5,000 per oz., and even took its chance to reach $6,000. Since then, it has been a lot quieter. A new FOMO investment is the sheriff in town: oil!
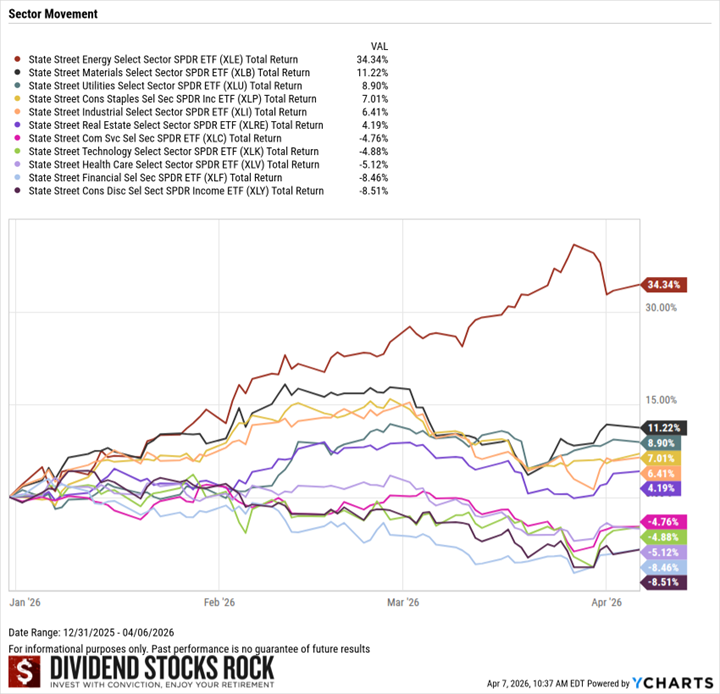
Energy stocks have been surging since the war in Iran started. After three months, energy and materials are generating most of your returns. Utilities continue to do well as the search for more power remains an important theme in 2026.
As we usually see during volatile times, there is an increase in interest for consumer staples stocks. After all, we will need those products regardless of what is going on.
Industrial stocks (mostly related to investment in infrastructure, mining natural resources and AI data centers construction) and REITs are closing the performing sectors.
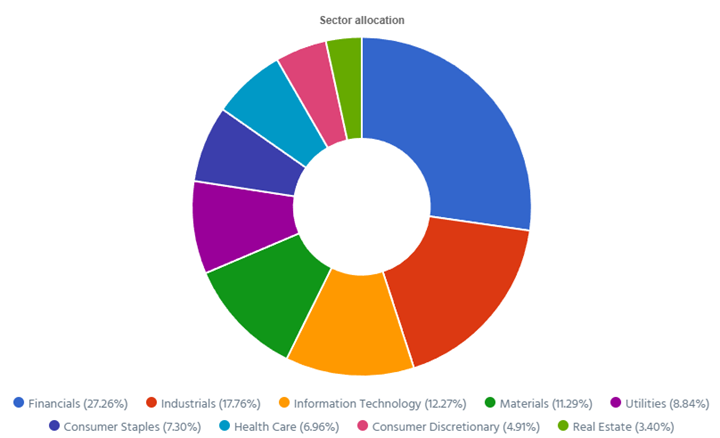
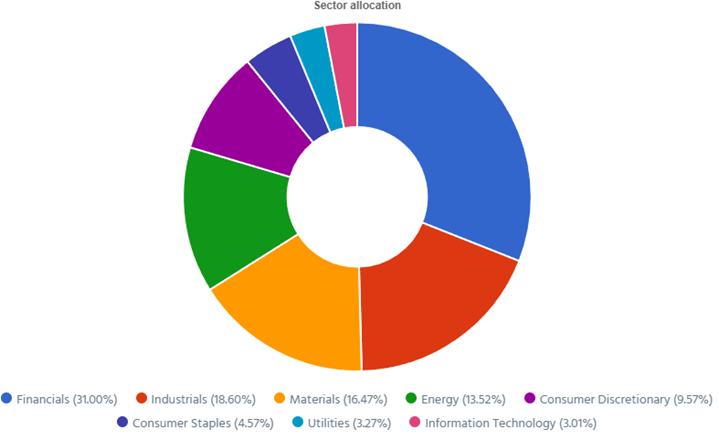
When I look at my sector allocation (big chunk in financial and technology), I’m happy with my returns!
Here is a podcast about my Q1 portfolio review trades and thoughts:
A word of caution about Fear Of Missing Out (FOMO)
Now that you see what works and what does not, I want to remind you that this chart will change again in 3 months when I review each sector at the end of next quarter.
Therefore, for those who ran after gold and silver at the end of 2025, you will be tempted to run after energy in 2026. What will happen if the conflict in Iran is resolved? Chances are the oil prices will go back down as they have done each time over history. We just had a preview this Wednesday, as a simple cease-fire was enough to push the barrel price down by more than 15%.
Are you tired of buying late at each party?
It’s probably time to have a clear asset- and sector-allocation strategy. For example, I’ve made my peace a long time ago about not having much energy and gold stocks in my portfolio. Since I focus on dividend growers, that makes sense that I don’t have a large exposure to these sectors. I have a little exposure and I’m content with that.
When those sectors suffer, I don’t. When they surge, I look at others making money and I congratulate them for their investment.
When your neighbor makes money, it doesn’t mean you don’t.
So, you can be happy for him and stick to your strategy in the meantime.
That’s how I avoid FOMO investing: by sticking to my strategy and being content that I’m on par with my plan.
Too many moving parts, I remain still
After 3 months in 2026, I heard more noise than quality information. Therefore, I don’t intend to make any modifications to my portfolio at this point.
When the noise is too loud, I close the door and look at the numbers. DSR PRO makes it easy for me to monitor 34 companies’ quarterly earnings in a few hours. I prefer to focus on how revenue, earnings and dividends fluctuated in the past 12 months than how the stock prices have performed.
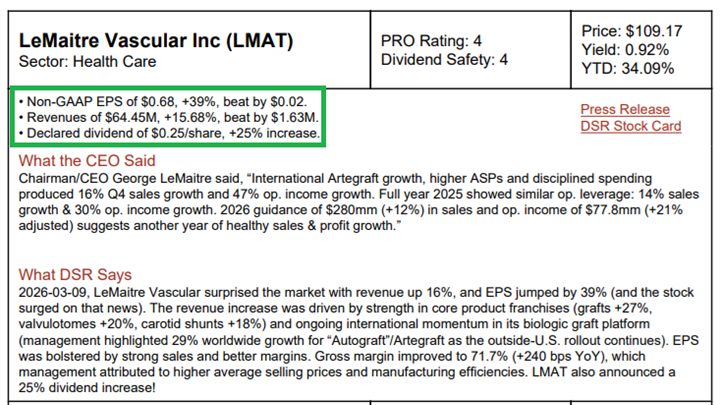
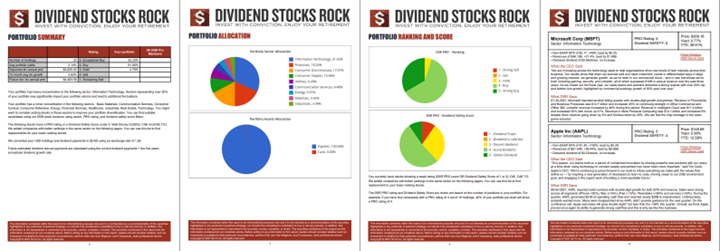
The DSR PRO report generates a half-page summary of what was important in the past 3 months for each of my holdings. You have an example below with LeMaitre Vascular (LMAT). The most important part is highlighted in green: revenue up 16%, EPS up 39% and a juicy dividend increase of 25%.
Once I’m done smiling at those numbers, I read what the CEO had to say about the quarter. He was quite happy with the results and highlighted international growth for one of its products: Artegraft.
Then, what DSR says will tell me where the growth is coming from. Sales were strong across core products and earnings surged on stronger sales and improved margins. I like when a company can generate economies of scale on top of showing stronger revenue.
Reading this summary takes me about 2 minutes per quarter. I have 34 holdings across all my portfolios, so that’s a little more than one hour per quarter. For most companies, the review stops there. After all, I don’t need to know more about LMAT’s quarter as all the numbers are fine.
Here is a podcast about my 9 biggest dividend increases of 2025 including LMAT:
For a few companies, numbers won’t be as great. This is where I’ll spend a few more hours digging deeper using the Press Release and the DSR stock card links.
Managing a portfolio of stocks with this report takes less than five hours per quarter. It’s a great way to not only save time but also ignore the noise and focus on what really matters: the numbers!
Speaking of which, I’m adding a very important number in my Smith Manoeuvre update: the interest paid so far. Many asked me how much interest I pay per year to have a clear picture of the Smith Maneuver in action.
I didn’t realize, but I started my SM portfolio exactly 4 years ago as my first interest payment was in April of 2022. Therefore, I’m adding the total interest paid so far.
In four years, my portfolio generated a net cash value of $34,447.75 (portfolio value) – $26,000 (total debt) – $2,232.81 (interest paid) = $6,214.94.
It’s a little more than that since the interest is tax-deductible, but I wanted to keep the numbers easy to follow.
If I had only paid my mortgage, I would have paid $26K on my loan. Today, if I liquidate my investment, I would have paid an extra $6.2K on my debt. Not too bad, right?
Smith Manoeuvre Update
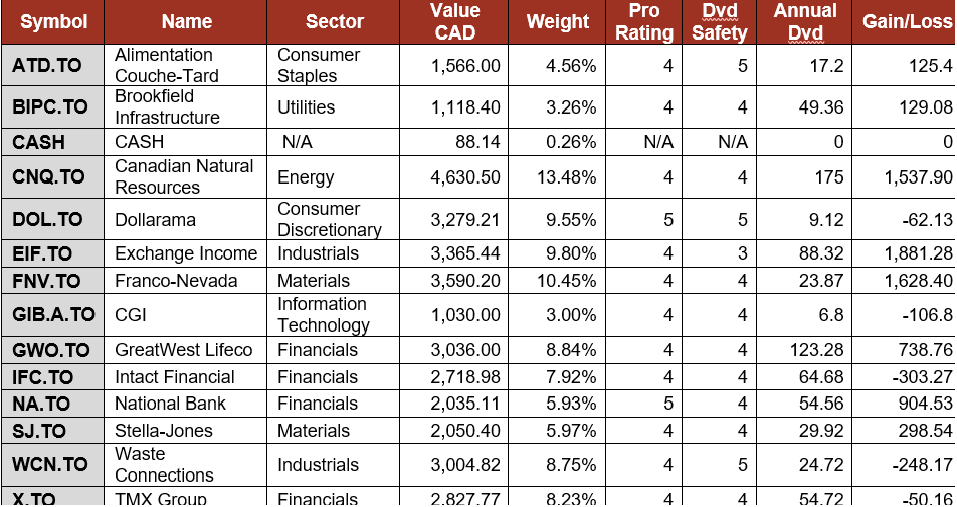
The portfolio shows 13 companies spread across 8 sectors. My goal is to build a portfolio of thriving companies with a solid dividend triangle (e.g. with positive revenue, EPS and dividend growth trends). The current portfolio yield is at 2.09% with a 5-year CAGR dividend growth rate of 11.93%.
- The portfolio value is now at $34,447.75
- The portfolio debt is at $26,000.
- Interest paid since April 2022: $2,232.81
- Monthly contribution is set at $1,000/month.
- The annual income is $721.55, and the projected income is $807.66
- To report my Smith Manoeuvre, I export the Excel data from my DSR PRO dashboard.
The portfolio is on its way towards generating an extra $1,000 per year in dividends. I’m not there yet, but it will happen in the first months of 2027! By then, my portfolio will be close to $50,000! That will be exciting to see a 13th influx of $1,000 to boost the portfolio!
Smith Manoeuvre Portfolio Summary
Here’s my SM portfolio summary as of April 6th, 2026 (before the bell):
$1,000 invested in DOL.TO
Dollarama reported a mixed quarter with revenue up 12%, but EPS was up only 2%. That sent the stock price down and created the temptation to invest a little more in this amazing company.
I still have my eyes on increasing my positions in TMX, Intact, Stantec, and CGI, but I couldn’t resist buying more of DOL after its earnings announcement!
Pension Portfolio Summary
Here’s my pension plan portfolio summary as of April 6th, 2026 (before the bell):
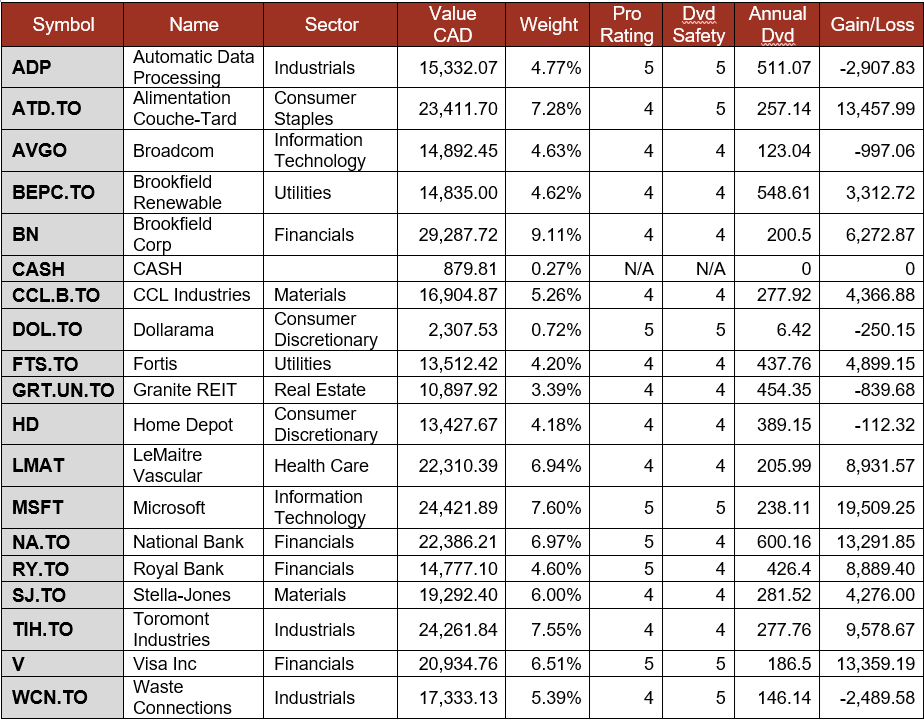
Total value: $321,406.88 (-$4,568.18, -1.40% from last month).
My Entire Portfolio Updated for Q1 2026
Each quarter we run an exclusive report for Dividend Stocks Rock (DSR) members who subscribe to our very special additional service called DSR PRO. The PRO report includes a summary of each company’s earnings report for the period. We have been doing this for an entire year now and I wanted to share my own DSR PRO report for this portfolio. You can download the full PDF showing all the information about all my holdings. Results have been updated as of April 7th, 2026. Next quarterly report will be available in July.
Download my portfolio Q1 2026 report.
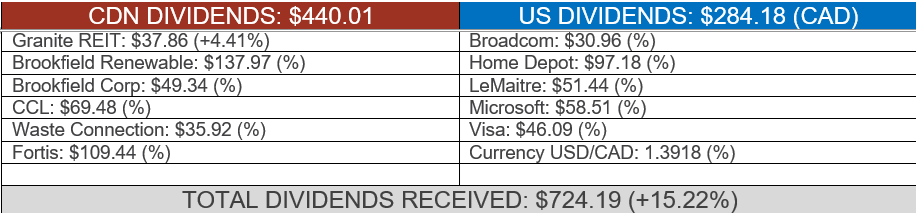
Dividend Income: $724.19 (+15.22% VS. MARCH 2025)
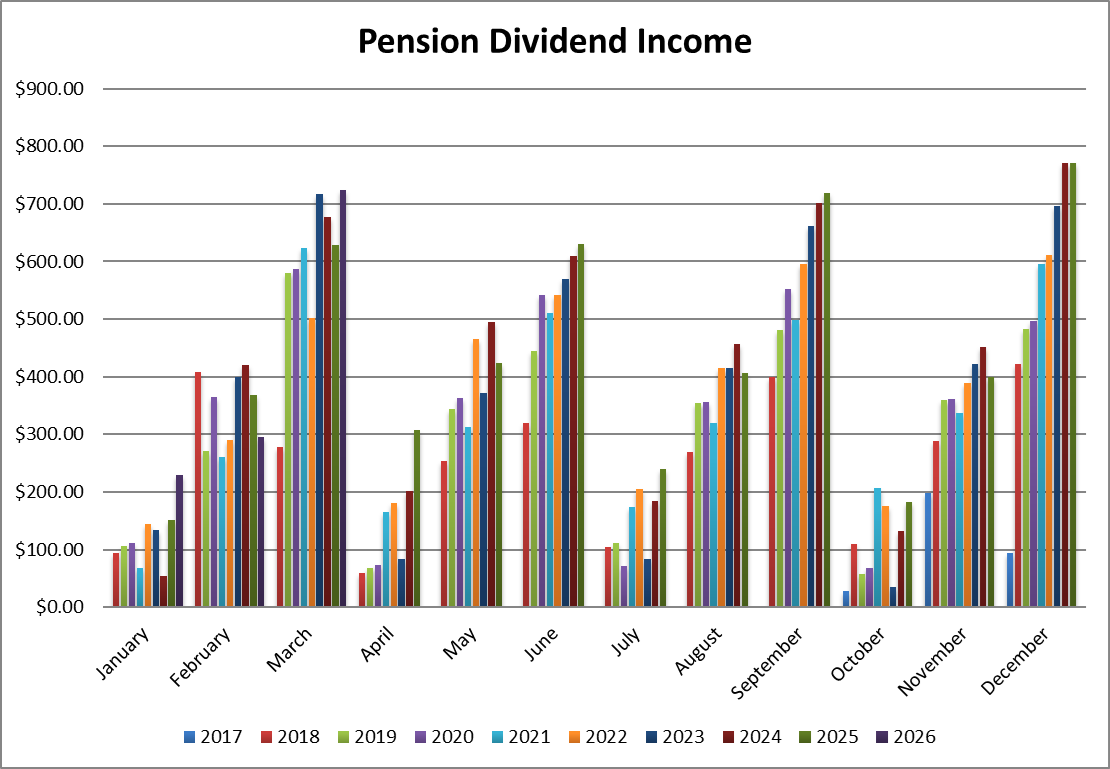
It feels good to see the dividend growing this month as the portfolio isn’t doing that well. I love to see those dividends coming in when the market is down!
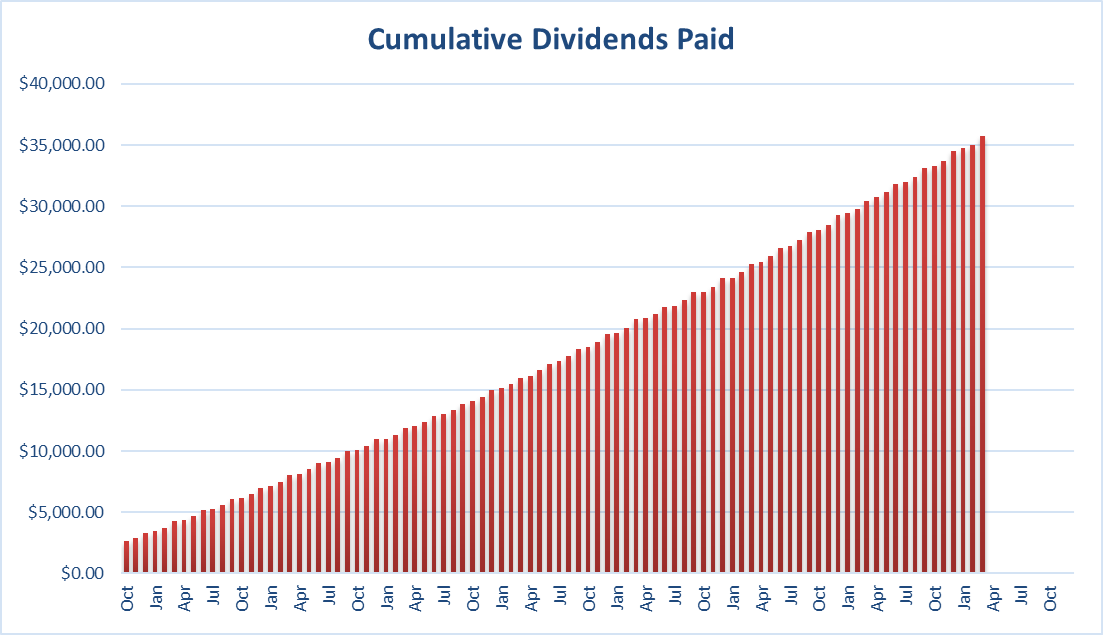
Since I started this portfolio in September 2017, I have received a total of $35,742.69 CAD in dividends. Keep in mind that this is a “pure dividend growth portfolio” as no capital can be added to this account other than retained and/or reinvested dividends. Therefore, all dividend growth is coming from the stocks and not from any additional capital being added to the account.
Final Thoughts
I’m accumulating more dividends in this portfolio, and I’ll shortly have another $1,000 to invest! I will likely add more of Broadcom (AVGO) as I’m not yet fully invested at 3% of the portfolio in this security.
Cheers,
Mike.


Leave a Reply