
In September of 2017, I received slightly over $100K from my former employer, representing the commuted value of my pension plan. I decided to invest 100% of this money in dividend growth stocks.
Each month, I publish my results on those investments. I don’t do this to brag. I do this to show my readers that it is possible to build a lasting portfolio during all market conditions. Some months we might appear to underperform, but you must trust the process over the long term to evaluate our performance more accurately.
This month, I also share more thoughts on when to sell.
Performance in Review
Let’s start with the numbers as of August 2nd 2024 (before the bell):
Original amount invested in September 2017 (no additional capital added): $108,760.02.
- Current portfolio value: $269,260.95
- Dividends paid: $4,871.87 (TTM)
- Average yield: 1.80%
- 2023 performance: +20.69%
- SPY= +26.19%, XIU.TO = +11.87%
- Dividend growth: +1.7%
Total return since inception (Sep 2017 – August 2024): 147.57%
Annualized return (since September 2017 – 82 months): 14.19%
SPDR® S&P 500 ETF Trust (SPY) annualized return (since Sept 2017): 14.35% (total return 150.00%)
iShares S&P/TSX 60 ETF (XIU.TO) annualized return (since Sept 2017): 9.98% (total return 91.60%)
Holding or Selling – More Thoughts on When to Sell
In the past, I have discussed when to sell several times. However, I tend to use “extreme” examples to illustrate my strategy. I either discuss major losers and dividend cutters which should generate an immediate sell, or, on the other side, my strongest winners.
An alternate question was brought up by a DSR member recently: “what to do with stocks in the middle?”. In other words, if you lose just a small amount of money or if the stock in your portfolio is up, but still not overweight; what is the best way to deal with those situations?
As is often the case in investing, a simple question leads to many more:
- Should I sell and protect my profit?
- The valuation is getting high, is it time to sell?
- The stock is down 10%, should I minimize my losses?
- The market has been on a tear for many months, should I seek shelter from a crash?
- There was bad news about company ABC, so is it time to sell before it gets worse?
As you can see, most of these questions lead to one conclusion: finding the right time to sell.
Instead of being a Monday Morning Quarterback and playing the hindsight game, I would rather try to help you with a set of specific rules to determine if you should hold or sell any of your holdings. This is the methodology I have used to sell many of my holdings over the years.
First – Quarterly reviews
I review my holdings quarterly using my DSR PRO report. This is an easy read that takes a couple of hours. Once I have reviewed all the earnings, I look at the dividend triangle. If nothing has changed (e.g. my investment thesis is still valid and the dividend triangle remains strong), then I keep my stocks.
I’m not looking to actively trade my holdings, and I prefer to keep them a little longer than being trigger-happy.
Second – What if there is a change in the investment thesis?
We all wish businesses would remain the same and the economic environment would be stable. Unfortunately, however, change happens all the time. Therefore, it’s crucial to constantly validate the reasons why you bought a stock are still valid today. For example, I had to sell Andrew Peller as the company stopped growing through acquisitions and that was one of the reasons I wanted this holding in my portfolio. I also sold Enbridge as its growth potential had been seriously impacted by higher interest rates.
When a company starts to move in a different direction than I originally expected, I will not sell right away. I usually monitor the company’s results and actions for a period of 12 to 24 months. It’s a “long” period of time for many, but that’s the time required for me to gain full certainty I’m making the right move. It also gives the company’s management enough time to show me if they can generate value under their new direction.
After that delay, I must take action and sell. One other trick I use is to keep a short list of stocks I really like that are not in my portfolio. It’s always easier to sell a holding when you already have candidates in mind to replace them.
Third – What if there is a change in the dividend triangle?
While the investment thesis may remain valid for a longer time, dividend triangles can be measured quarterly. We can think of what recently happened to Nike (NKE) and Starbucks (SBUX) as both companies suffered from customers being tight with their budgets.
Again, in an ideal world, revenue, EPS and dividends would always go up at a steady pace. When there is a slowdown in any of those metrics, we must know what do to?
First, you must add some context as to why revenue or earnings are slowing down. You must understand what is happening first before taking any action. Then, once you have a clear explanation, you must determine if this “problem” is permanent (e.g. Nike is constantly losing market shares, and most people don’t buy sports apparel anymore and we all hate being active) or if it’s likely temporary (Nike is facing economic headwinds as consumers don’t spend as much due to higher interest rates).
If it’s clearly a temporary problem, you can wait several quarters or even a couple of years. After all, the economy could recover within 2-3 years, and you will see signs of improvement quickly.
Similar to the investment thesis review, I’m willing to keep a stock for 2 maybe 3 years with a weaker dividend triangle, especially if we are talking about a cyclical company.
This is why I ended up selling a company like Hasbro (HAS) with a decent profit just as revenue, earnings, and dividend growth were slowing down. I sold Magna International (MG.TO) not too long ago mostly for showing hectic financial metrics with no clear direction for resolution of that problem.
Here are more details on how I do my quarterly review.
Fourth – Don’t overthink it
In many cases, you must trust your gut and remind yourself that you have done your due diligence when you added the position to your portfolio. Giving between 12 to 36 months when there are minor changes is giving you time to reflect and you are also giving enough time to management to turn things around.
As you can see, at no time did I look at the stock performance in this process. Regardless of whether the stock price is up or down, I’d rather follow my process than trade based on short-term price fluctuations. I’ve seen too many price movements create more noise than anything else.
Smith Manoeuvre Update
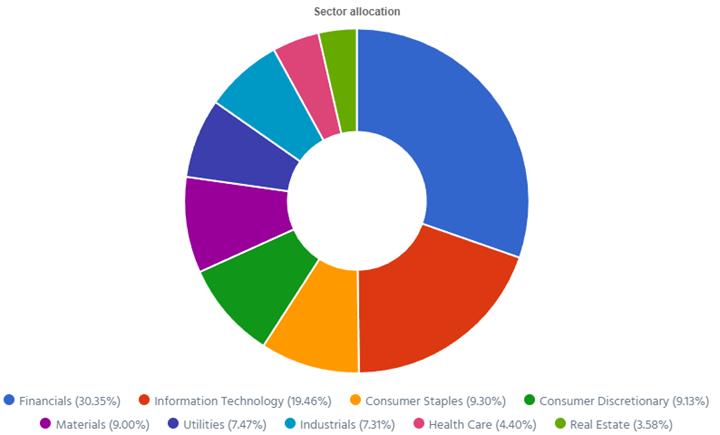
Slowly but surely, the portfolio is taking shape with 11 companies spread across 7 sectors. My goal is to build a portfolio generating 4-5% in yield across 15 positions. I will continue to add new stock monthly until I reach that goal. My current yield is 4.85%.
Paying down the margin by $500
Last month, I made a “larger play” into CWB.TO by purchasing about $1,500 worth of shares. I used my regular $500 per month plus $1,000 from the margin account to make that purchase. This month, I’m not doing a new buy and simply reimbursing a portion of the margin account.
I’m using the margin account when I see a good opportunity and I want to bolster my position quickly. Once again, keep in mind that it’s not a significant amount compared to all my assets and that’s why I’m “playing” with this money.
Here’s my SM portfolio as of August 2nd, 2024 (before the bell):
| Company Name | Ticker | Sector | Market Value |
| Brookfield Infrastructure | BIPC.TO | Utilities | $1,069.00 |
| Canadian National Resources | CNQ.TO | Energy | $1,066.56 |
| Capital Power | CPX.TO | Utilities | $1,257.44 |
| Canadian Tire | CTA.A.TO | Consumer Disc. | $984.34 |
| Canadian Western Bank | CWB.TO | Financials | 1660.05 |
| Exchange Income | EIF.TO | Industrials | $1,539.20 |
| Great-West Lifeco | GWO.TO | Financials | $702.44 |
| National Bank | NA.TO | Financials | $1,267.31 |
| Nutrien | NTR.TO | Materials | $899.99 |
| Telus | T.TO | Communications | $1,383.48 |
| TD Bank | TD.TO | Financials | $1,127.98 |
| Cash (Margin) | -$395.35 | ||
| Total | $12,562.44 | ||
| Amount borrowed | -$11,500.00 |
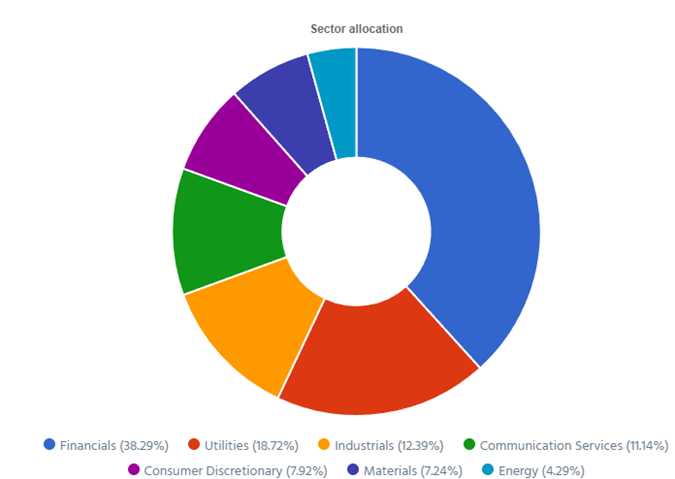
Let’s look at my CDN portfolio. Numbers are as of August 2nd, 2024 (before the bell):
Canadian Portfolio (CAD)
| Company Name | Ticker | Sector | Market Value |
| Alimentation Couche-Tard | ATD.TO | Cons. Staples | $24,697.40 |
| Brookfield Renewable | BEPC.TO | Utilities | $9,920.10 |
| CCL Industries | CCL.B.TO | Materials | $10,378.20 |
| Fortis | FTS.TO | Utilities | $9,900.90 |
| Granite REIT | GRT.UN.TO | Real Estate | $9,514.24 |
| National Bank | NA.TO | Financials | $13,940.41 |
| Royal Bank | RY.TO | Financial | $9,904.05 |
| Stella Jones | SJ.TO | Materials | $13,516.68 |
| Toromont Industries | TIH.TO | Industrials | $5,908.37 |
| Cash | $491.14 | ||
| Total | $108,171.49 |
My account shows a variation of +$4,143.69 (+3.98%) since July’s income report.
A few Canadian companies have reported their earnings as of late. Let’s do a quick review!
Brookfield Renewable can’t get love from the market
Brookfield Renewable reported a good quarter with revenue up 22% and FFO per share up 6%, but it wasn’t enough to generate any love from the market. The company reported FFO of $339M (+9%), and management confirmed it’s on track to achieve its goal of generating FFO growth of 10%+ per year. The hydroelectric segment delivered FFO of $136M, benefiting from strong all-in pricing, particularly in North America, and solid generation in Brazil. The wind and solar segments generated a combined $194M of FFO, driven by recent additions in North America, Europe and India. The distributed energy, storage, and sustainable solutions segments generated a combined $86M of FFO in the quarter.
Fortis reported strong earnings
Fortis reported a good quarter with EPS up 8%. The increase was driven by strong earnings in Arizona reflecting new customer rates at Tucson Electric Power, and higher retail electricity sales associated with warmer weather. Rate base growth across their utilities and the timing of recognition of the new cost of capital parameters approved for FortisBC in 2023 also contributed to earnings growth. The increase was partially offset by lower earnings for Central Hudson and the Other Electric segment which largely reflected higher operating costs. FTS reported Capital expenditures of $2.3 billion in the first half of 2024 which fully supported their $4.8 billion annual capital plan.
Toromont Industries sees expenses rising
Toromont Industries reported a mixed quarter as revenue jumped by 16%, but EPS declined by 2%. The Equipment Group was up 15% and CIMCO was up 19%. Higher revenue in the Equipment Group resulted from solid equipment deliveries against their order backlog. Product support revenue was healthy while rental revenue declined slightly on easing market conditions. CIMCO’s growth reflects good package and product support activity levels. Unfortunately, EPS was affected by lower gross margins and higher expenses. TIH will expand its product and service offerings within the Equipment Group, particularly in digital solutions and telematics to enhance equipment efficiency and customer service.
Here’s my US portfolio now. Numbers are as of August 2nd, 2024 (before the bell):
U.S. Portfolio (USD)
| Company Name | Ticker | Sector | Market Value |
| Apple | AAPL | Inf. Technology | $8,734.40 |
| Automatic Data Processing | ADP | Industrials | $9,929.40 |
| BlackRock | BLK | Financials | $12,114.90 |
| Brookfield Corp. | BN | Financials | $16,319.94 |
| Home Depot | HD | Cons. Discret. | $10,757.40 |
| LeMaitre Vascular | LMAT | Healthcare | $8,625.00 |
| Microsoft | MSFT | Inf. Technology | $19,604.17 |
| Starbucks | SBUX | Cons. Discret. | $7,060.34 |
| Texas Instruments | TXN | Inf. Technology | $9,666.50 |
| Visa | V | Financials | $13,296.50 |
| Cash | $436.47 | ||
| Total | $116,545.02 |
My account shows a variation of +$5,409.73 (+4.87%) since July’s income report.
Apple generates so much revenue!
Apple reported a solid quarter with revenue up 5% and EPS up 14% which easily beat the analysts’ expectations. This new June quarter revenue record was driven by strong performance in the services segment which achieved an all-time revenue record of $24.2B (+14%). The growth in services was complemented by the launch of new iPad models contributing to Products revenue of $61.6B (+2%).? Apple has worked on several strategic initiatives, including the expansion of Apple TV+ productions, new features for Apple Pay, and updates to Apple Fitness+. The company also introduced Apple Intelligence; a generative AI system integrated into its devices.
Automatic Data Processing keeps on rocking!
Automatic Data Processing reported a solid quarter beating analysts’ expectations with revenue up 7% and EPS up 11%. Employer Services revenues increased 7% and new business bookings increased 7%. PEO Services revenue increased 6%. The company reported EBIT margin improvements of 80 basis points, pushing EPS higher. For its fiscal year of 2025, ADP expects revenue to grow 5%-6%, adjusted EBIT margin to expand 60-80 basis points, and adjusted diluted EPS to increase 8%-10%. In other words, we are in for another year with a strong dividend triangle!
BlackRock surfs the bull market
BlackRock reported a good quarter which beat analysts’ expectations with revenue up 8% and EPS up 12%. This growth was driven by higher performance fees which increased by 39% to $164 million, and a 10% rise in technology services revenue. The company’s strong revenue performance reflects its ability to leverage market conditions and its diversified business model?. Operating income also saw a significant increase of 12%, reaching $1.9 billion. BlackRock’s adjusted operating margin improved by 160 basis points to 44.1% which demonstrated effective cost management and operational efficiency?.
LeMaitre Vascular doesn’t slowdown
LeMaitre Vascular is on a roll with another strong quarter beating the analysts’ expectations where revenue increased by 11% and EPS jumped by 41%. This growth was driven primarily by strong sales in the biologic vascular patch and collagen vascular graft segments. The company’s strategic focus on expanding its product portfolio and increasing its market share in vascular devices contributed significantly to this revenue increase. LeMaitre’s gross margin improved due to better cost management and a favorable product mix. They maintained a stable operating margin despite increased investments in R&D and marketing initiatives. LMAT also increased its guidance!
Microsoft disappoints with double-digit growth
Microsoft reported another solid quarter with revenue up 15% and EPS up 10% which only slightly beat the analysts’ expectations. By segment: Productivity and Business Processes +11%, driven by Office commercial products (+12%), LinkedIn (10%) and Dynamics 365 (+19%). Intelligent Cloud was up 19% (Azure +29%). Ironically, the market was disappointed by Azure’s performance. More Personal Computing +14%, driven by Xbox (+61%) as it integrated the acquisition of Activision Blizzard (previously ATVI). MSFT has many growth vectors in place!
Starbucks struggles to sell more coffee
It wasn’t a glorious quarter for Starbucks, but it was expected. Revenue was down slightly by 1% and EPS decreased by 7%. Global comparable store sales fell 3% which was expected, but it is still not good news. The average sales ticket was up 2%, but the overall transaction count was 5% lower during the quarter. The decline was attributed to a challenging macroeconomic environment, although strong performance in specific product categories provided some offset. Starbucks is accelerating its store development efforts with plans for 580 net new stores and over 800 renovations in North America for FY 2024. This means, lower EPS to come before it bounces back.
I have shared more views about Starbucks, Deere and Nike in the video below.
Texas Instruments focuses on sequential improvements
Texas Instruments reported a weak quarter with revenue down 16% and EPS off 37%, but it was expected by the market. The year-over-year decline was primarily due to significant drops in the analog (down 11%) and embedded processing segments (down 31%). However, personal electronics and enterprise systems showed strong sequential growth with personal electronics up nearly 20% year-over-year. The gross margin improved by 60 basis points sequentially due to higher revenue and lower manufacturing unit costs?. For Q3 2024, Texas Instruments provided revenue guidance of $3.94B to $4.26B and EPS guidance of $1.24 to $1.48.
Visa or the “tollbooth stability model”
Visa reported another “clockwork” quarter with revenue up 10% and EPS up 12%. This growth was driven by a rise in payment volumes, processed transactions, and cross-border volume. The company’s new flows revenue grew by 14% year-over-year on a constant dollar basis highlighting the expansion of Visa Direct and other payment solutions?. The company’s gross margin remained robust, contributing to the higher EPS?. The company also highlighted its strategic investments, including the expansion of Visa Direct and other technological advancements, to support future growth?.
My Entire Portfolio Updated for Q2 2024
Each quarter we run an exclusive report for Dividend Stocks Rock (DSR) members who subscribe to our very special additional service called DSR PRO. The PRO report includes a summary of each company’s earnings report for the period. We have been doing this for an entire year now and I wanted to share my own DSR PRO report for this portfolio. You can download the full PDF showing all the information about all my holdings. Results have been updated as of June 30th, 2024.
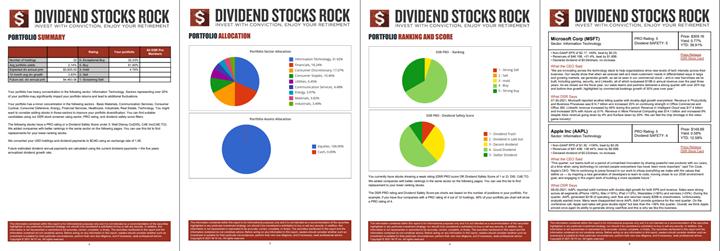
Download my portfolio Q1 2024 report.
Dividend Income: $183.90 CAD (+118% vs July 2023)
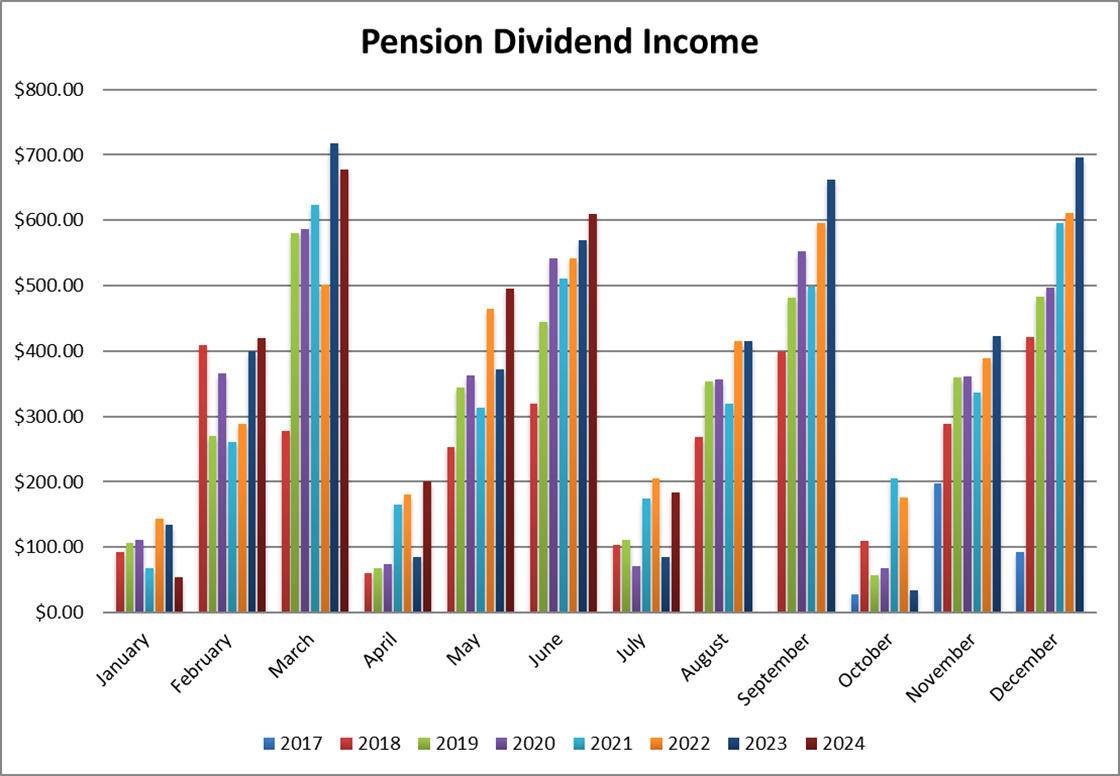
118% increase! All right, that is mostly driven by new stocks paying on that quarterly cycle. Toromont Industries and Automatic Data Processing are new additions to my portfolio and helped bolster my weakest dividend quarterly cycle.
Couche-Tard and Granite showed small increases mostly because I had to sell shares of ATD as part of my rebalance portfolio strategy. Currency fluctuation helped on the ADP dividend since the currency rate was $1.3399 CAD to $1 USD last year. We are now getting close to $1.40!
Dividend growth (over the past 12 months):
- Alimentation Couche-Tard: +4.12% (I sold some shares)
- Granite: +3.14%
- Toromont: new
- Automatic Data Processing: new
- Currency: +4.75%
Canadian Holding payouts: $110.09 CAD.
- Alimentation Couche-Tard: $52.33
- Granite: $35.20
- Toromont: $22.56
U.S. Holding payouts: $53.20 USD.
- Automatic Data Processing: $53.20
Total payouts: $183.90 CAD.
*I used a USD/CAD conversion rate of 1.3874
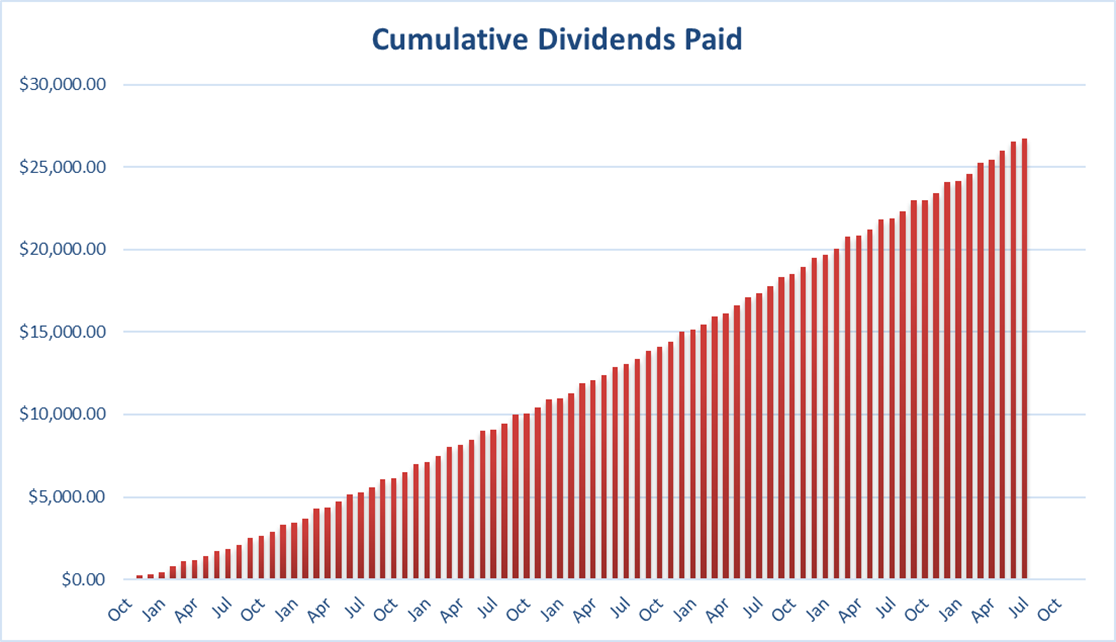
Since I started this portfolio in September 2017, I have received a total of $26,754.64 CAD in dividends. Keep in mind that this is a “pure dividend growth portfolio” as no capital can be added to this account other than retained and/or reinvested dividends. Therefore, all dividend growth is coming from the stocks and not from any additional capital being added to the account.
Final Thoughts
Ironically, many investors thought that “selling in May” this year was a smart move as the market was trading at an all-time high. Once again, the “stay invested” strategy proves that it’s not only easier to follow (you literally have nothing to do!), but it is also more profitable most of the time.
I’m not going to avoid the market crash whenever it happens, but my portfolio will have benefitted from years of gains before getting hit by the storm. That’s the benefit of having a clear strategy, isn’t it?
Cheers,
Mike.


Leave a Reply