
“If investing was only about revenue minus costs equals profit, we’d all be Warren Buffett by now, right?”
Yet here we are, looking at companies like Broadcom or Brookfield, scratching our heads. Sales are booming. Dividends keep flowing. But… EPS (earnings per share) is falling? What gives?
Today, we dive into a crucial (and misunderstood) piece of the dividend triangle: Earnings Per Share.
Spoiler alert: EPS is not nearly as straightforward—or as useful on its own—as many investors think.
What is EPS (And Why It’s Not Enough)?
Let’s start with the basics. EPS is the amount of profit a company earns per share of stock. Sounds simple enough, right?
EPS = (Net Income – Preferred Dividends) ÷ Average Outstanding Shares
EPS is baked into some of the most common investing ratios:
-
P/E ratio (Price to Earnings)
-
Payout ratio (Dividends divided by EPS)
If you want to know if a company can afford to pay its dividends, you look at the payout ratio:
Payout ratio: Dividend per share/Earnings per share
If you want to know if a company trades at a fair value, you can look at the Price to Earnings (PE) ratio:
Price to earnings (PE): Stock price/Earnings per share
So if a company grows its earnings, everything looks great—payouts are sustainable, valuation seems fair, and the stock might be a buy.
But here’s the kicker: EPS is easily distorted.
Why EPS Goes Weird (Even When the Business is Healthy)
There are plenty of times when a company’s EPS doesn’t reflect its actual performance. Some of the biggest culprits include:
-
Amortization & depreciation: Non-cash charges that reduce earnings but don’t hurt the company’s ability to pay dividends.
-
One-time gains or losses: Selling an asset, legal settlements, restructuring costs—these can spike or sink earnings for a single quarter or year.
-
Foreign exchange fluctuations or investment gains can also disrupt things.
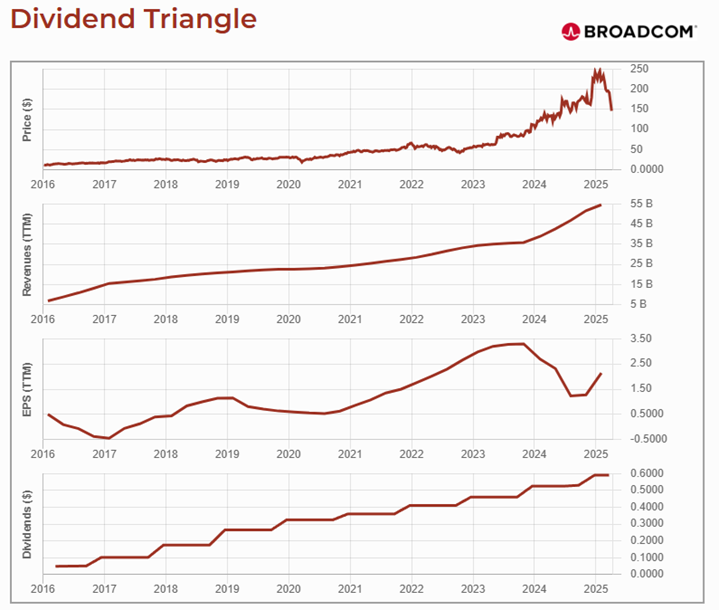
Take Broadcom as an example. Its revenue climbed steadily year after year, but EPS dropped in 2017, 2020, and 2024. That doesn’t mean management forgot how to run the business—it means you need to dig deeper into what’s behind the numbers.
What to Watch Instead (Depending on the Sector)
Here’s the real trick: different industries report earnings differently. EPS is a good starting point, but it is often not the best metric.
Capital-intensive companies are tricky, as the capital expenditure (CAPEX) will greatly influence how earnings are calculated.
Here’s what to consider instead:
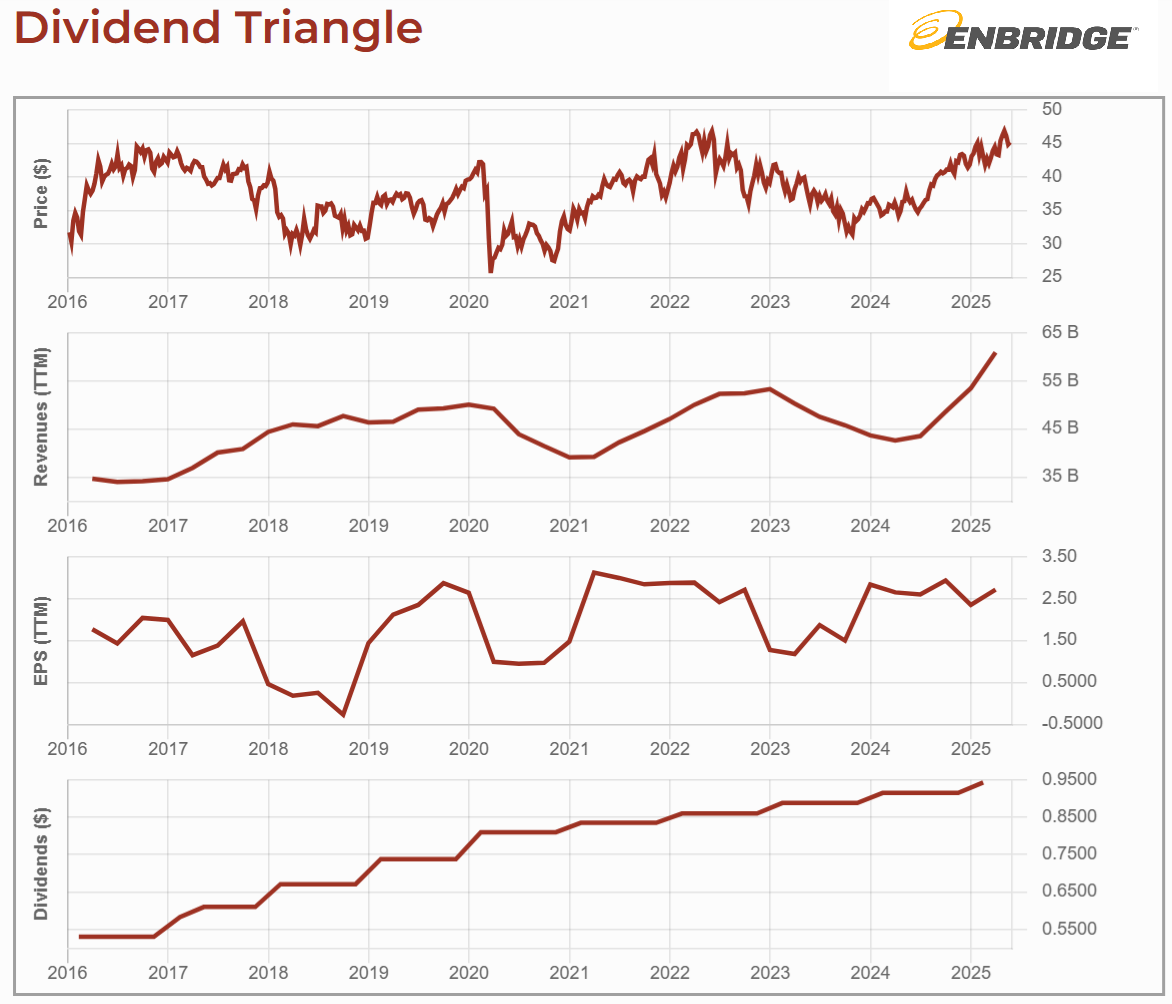
Pipelines
The classic of the classics for strange EPS is Enbridge’s (ENB.TO) dividend and then its EPS. The company shows a high payout ratio that could hit 200% or 300%! Pipelines are known to invest massively in their infrastructure. It then creates massive depreciation numbers on their income statement.
Many energy companies spend money on their infrastructure and exploration of new resources.
What to watch: Funds from operations (FFO), cash flow per share, or free cash flow.
Utilities
Like pipelines, utilities typically spend lots of cash on new projects, leading to heavy depreciation. Add to this mergers & acquisitions and you have a large number of adjustments to see if a company can afford to pay a dividend or not.
Often, the payout ratio won’t make sense and you must combine free cash flow and new debts (that is not used to pay the dividend, but rather to pay for the CAPEX or acquisition).
What to watch: Funds from operations (FFO) and FFO per share are often good metrics to follow.
Big Pharma
Companies like AbbVie (ABBV) or Johnson & Johnson (JNJ) spend an incredible amount of money on Research and development (R&D) to develop new drugs that are protected by patents. These business models are also more subject to lawsuits than other models.
The R&D spending is part of their business model and reduces the company’s ability to pay a dividend. However, the depreciating value of a patent will affect earnings, but not the company’s ability to pay a higher dividend.
Those companies are also known for big mergers (or spin-offs like Kenvue with JNJ). Major transactions will have an impact on EPS.
What to watch: You can still use the EPS, but keep an eye on lawsuits and patent expiry announcements.
Telcos
When you look at big guys like AT&T, Verizon, BCE, Telus and Rogers, they all talk about their cash flow on top of mentioning earnings. Again, it makes sense since earnings will be greatly affected by amortization and depreciation.
Those companies will typically offer you a target payout ratio along with their own version of the ratio calculations (based more on cash flow).
The downside is that in most cases that I’ve listed here, you must trust management for the numbers. Earnings are part of the Generally Accepted Accounting Principles (GAAP) provided in financial statements. “Homemade calculations” by management will not be used in a dividend triangle graph.
What to watch: Company-defined cash flow metrics, capex trends, and payout guidance.
Warning: These “adjusted” numbers are non-GAAP. Trust, but verify. Dig into quarterly reports or check out DSR’s stock cards to get the story straight.
REITs
REITs are leverage machines. Amortization, debt costs, and lease structures make EPS almost useless.
What to watch: Adjusted Funds from Operations (AFFO), occupancy rates, debt maturity schedule.
Not Sure Where to Start?
If you’re reading this and thinking, “Okay, I get the Dividend Triangle… but how do I find companies that actually follow it?” — we’ve got you covered.
The Dividend Rock Star List is our go-to tool to spot reliable, growing dividend stocks.
It’s built on the exact metrics we just walked through: revenue, earnings, and dividend growth.
Smart filters. Proven results.
Whether you want U.S. tech, Canadian banks, or global giants—we’ve already done the homework.
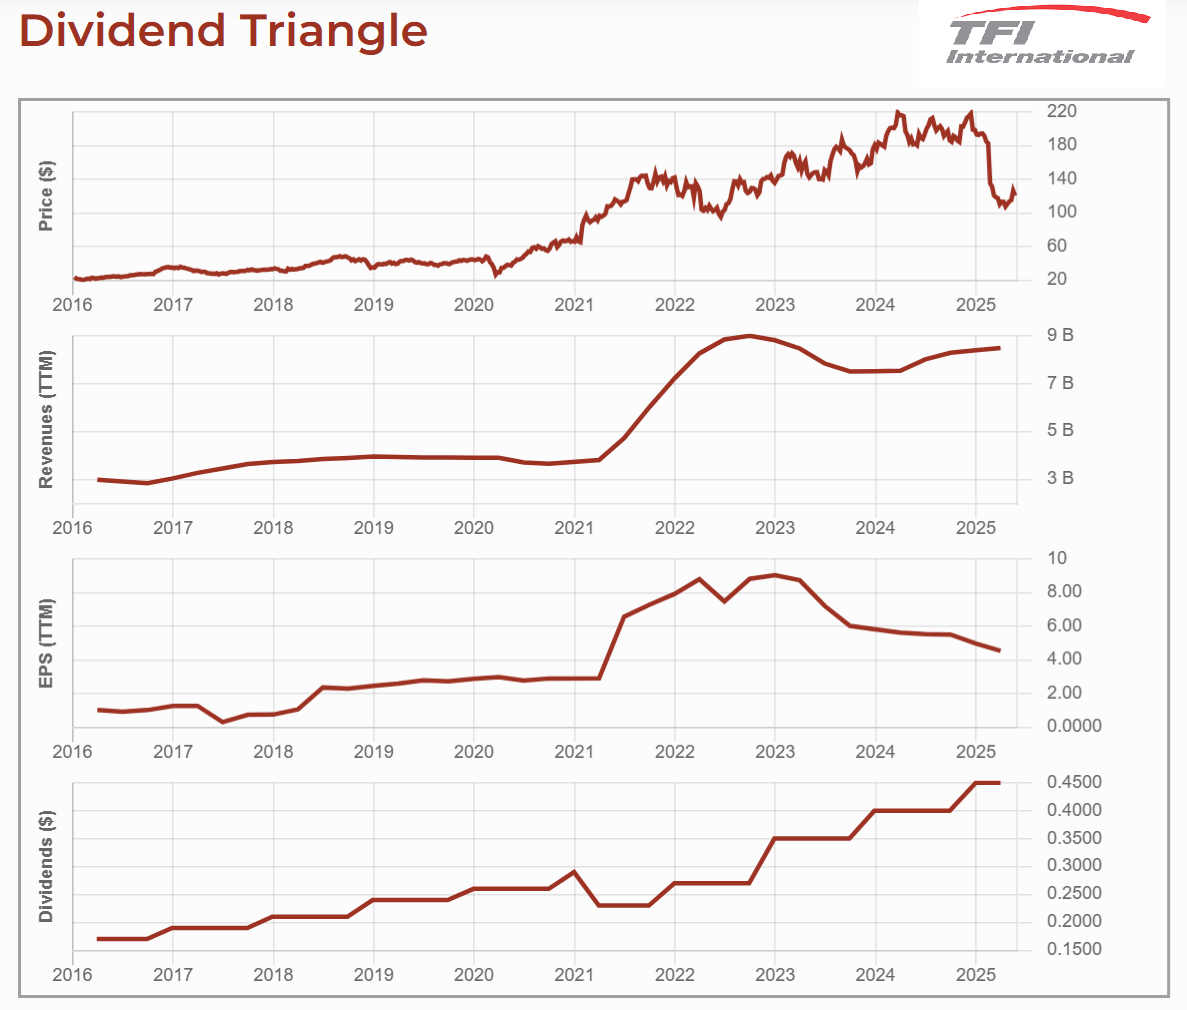
Growth by Acquisition (e.g., Broadcom, TFI International)
Some companies grow not by launching new products, but by buying others—again and again. Think Broadcom or TFI International. These “serial acquirers” regularly shake up their financials with big-ticket purchases.
Acquisitions usually come with:
-
Upfront costs (legal, advisory, integration)
-
New debt (which bumps up interest expenses)
-
Synergies down the road (like consolidating marketing or admin teams)
This creates lumpy earnings—often showing a dip before improving. EPS might fall while revenue surges, making short-term analysis tricky.
What to watch: Look past EPS. Focus on cash flow, management’s M&A track record, and whether those “synergies” ever show up. If a company has a history of smooth integrations and rising free cash flow, they’re probably doing it right.
Banks & PCLs (Provisions for Credit Losses)
Bank EPS can fluctuate significantly when economic conditions deteriorate. That’s because when recession risks rise, banks boost their provisions for credit losses (PCLs)—setting aside extra money in case more loans go bad.
A big spike in PCLs can make earnings look weak, even if the underlying business is stable.
But here’s the play: most banks are ultra conservative. They often over-provision during tough times, and when conditions improve, they reverse some of that caution.
This “PCL recovery” puts the money back on the books, boosting EPS the following year.
What to watch: Examine PCL trends and whether the bank has a history of managing the narrative. A temporary hit to EPS might just be management playing defense—setting up for stronger earnings later.
Not Sure How They Make Money? Move On
Here’s the golden rule:
“If you don’t understand how a business makes money, skip it.”
Don’t fall into the trap of trying to force-fit EPS into a business model you don’t get. Companies like Brookfield may need a PhD to decipher—no shame in sticking with simpler plays.
Investing should be clear, repeatable, and logical. If EPS is all over the place and management’s guidance doesn’t help, you’re better off with a company that gives you confidence, not confusion.
Wrap-Up: EPS is Just One Piece of the Puzzle
EPS matters—but only in context. It’s one of many metrics dividend investors should use. Here’s what to remember:
-
EPS can be misleading, especially for REITs, utilities, and acquisition-heavy companies.
-
Always pair EPS with revenue and dividend trends—the core of the dividend triangle.
-
When EPS looks weird, dig deeper. Look at free cash flow, sector-specific metrics, and company presentations.
-
If the story doesn’t add up, or you just don’t get the business model—skip it.
Want a Shortcut to the Best Dividend Growers?
Tired of sorting through dozens of confusing earnings reports?
That’s why we built the Dividend Rock Star List—a handpicked lineup of companies that crush it on revenue, earnings, and dividend growth (aka the Dividend Triangle).
These are the dividend growers that show up consistently, even when markets don’t.
Check out the Dividend Rock Star List here and find your next great stock—without the guesswork.


Leave a Reply