
Most investors think stock analysis starts with research. It doesn’t. It starts with a decision about how you make decisions.
I see buying and selling as two sides of the same coin. The reasons you use to buy a stock should be the same reasons you use to sell it. Get that right and you stop trading on price swings.
Ask yourself this. Does it make sense to sell a stock because it dropped 25%, while refusing to buy another because it climbed 25%? It doesn’t. Yet that is how most portfolios get managed.
You don’t need a CFA. You don’t need a dozen spreadsheets. You need a repeatable way to look at a business. Here is mine, in three parts: identify, understand, take action.
*Disclosure: This is education, not advice. Do your own due diligence.
Identify: start by eliminating
The first step of stock analysis is not research. It is elimination.
You cannot review 9,000 public companies. So you need a starting point. The easiest way is to pick your cherries from the best fruit basket. That is why I focus on dividend growth stocks. Those companies have already proved that their models work. They throw off enough cash to pay shareholders and keep growing the business.
There are many doors into that basket. Here are the eight I see most often.
Where good ideas come from
- Top-down. You start with the big picture, the economy, rates, geopolitics, then narrow to the sectors that benefit, then to individual names. “Rates are falling, so utilities and REITs may benefit, so I will look at quality names there.” It works when your macro call is right, which is harder than it sounds.
- Bottom-up. You ignore the macro noise and hunt for great businesses one at a time. You look at revenue, earnings, and dividend growth. The dividend triangle lives here. A great business compounds through most environments, so why try to time the economy?
- Stock screeners. You set your criteria and let the screener hand you a shortlist. This is a tool, not a strategy. It fits inside top-down or bottom-up. The catch: a screen only sees what is quantifiable, so the qualitative work still falls on you.
- Observation. You notice the line is always out the door at Starbucks and start there. I never use it. I have been a BCE customer for ten years and never wanted a single share.
- Peer and competitor analysis. You own a company you like, so you study its rivals and suppliers. Back in 2016, I bought Amazon after comparing Walmart, Target, and Amazon. Amazon won that round. It sat in my portfolio as a rare non-dividend payer for years.
- Thematic investing. You pick a long-term trend you believe in, aging demographics, AI infrastructure, the energy transition, and find the companies riding it. Top-down, but built on structural shifts instead of the cycle.
- Following smart money. Insider buying and fund manager filings can spark ideas. They are dangerous as recommendations. I avoid them. I can never know why an insider sells. The company might be in trouble, or they just want to buy a villa.
- News and events. Spinoffs, dividend hikes, earnings surprises, 52-week lows on quality names. I call this FOMO investing. A recent headline can’t taint how you see the next ten years.
My own approach combines two of these. I start with a screener to surface companies with a strong dividend triangle. Then I sort my research by sector, based on what I already own and which themes could move the market over the next five to ten years.
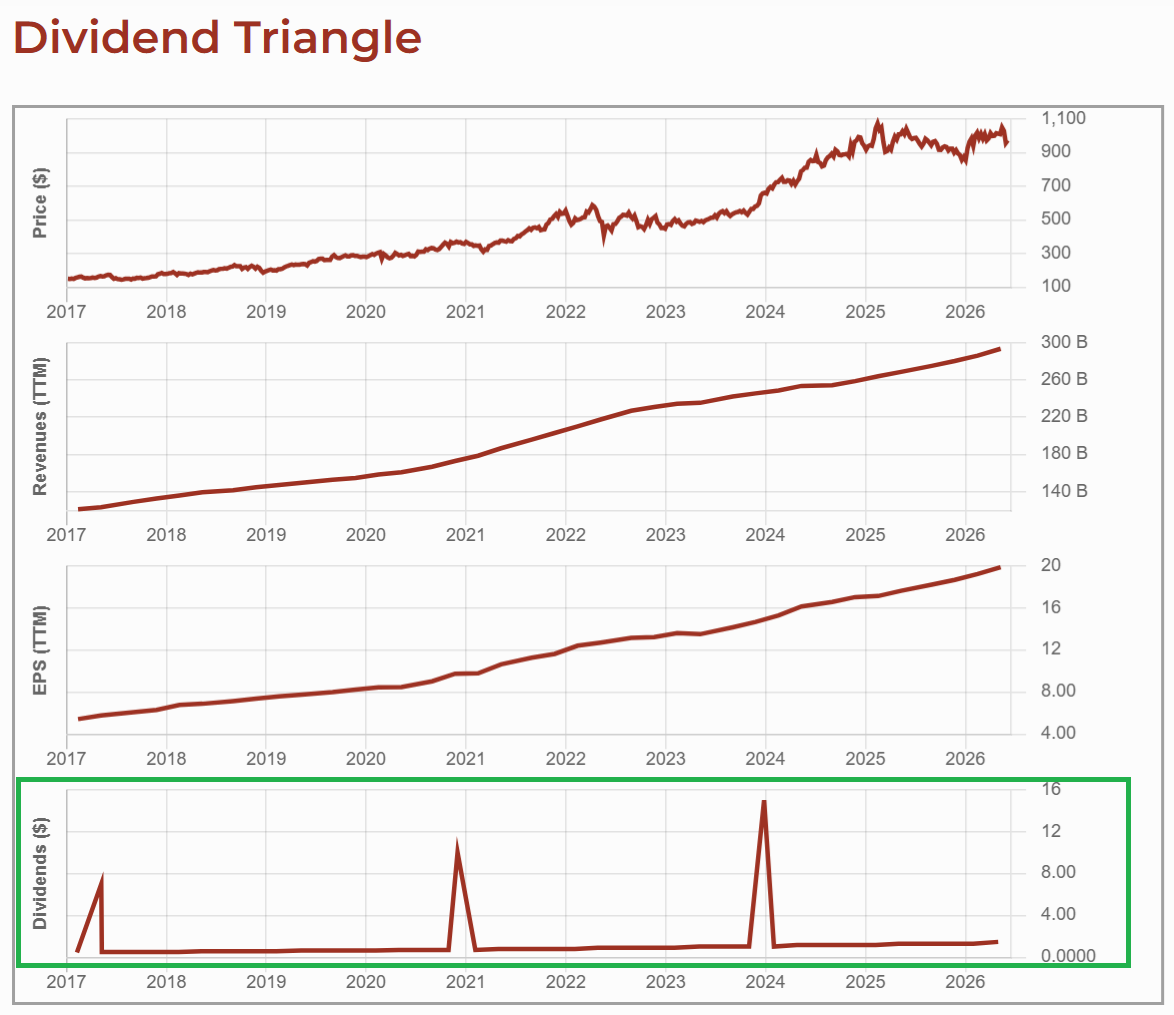
Read the dividend triangle first
The dividend triangle is not three financial metrics. It is a ten-year story about a business.
The three lines are revenue growth, earnings growth, and dividend growth. If you can explain why each one moved the way it did, you know the company inside out.
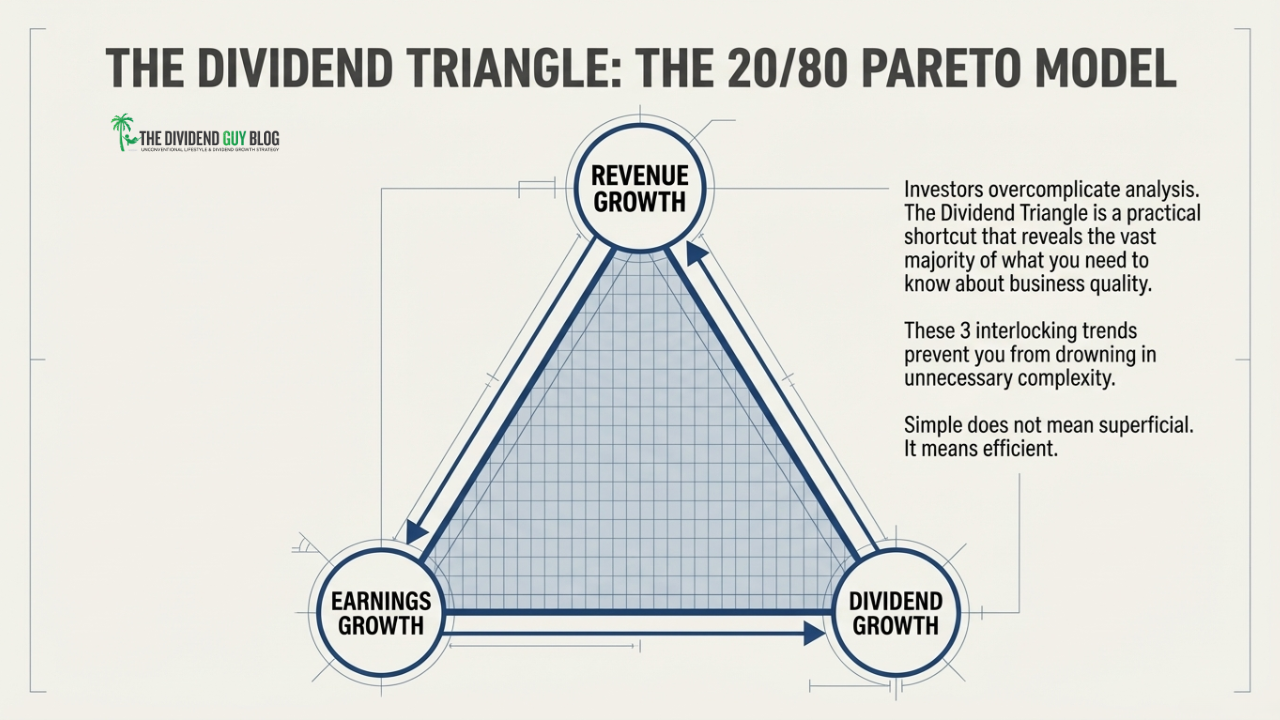
Revenue tells you how the company grows. A big jump usually means an acquisition. A flat line means a struggling business, often paired with a fat yield. A roller coaster means you are looking at a cyclical name.
Earnings, read against revenue, tell you about margins and cash flow. When earnings lag revenue, free cash flow tends to lag too. When revenue is soft but earnings still climb, the company is squeezing out efficiency. That is fine, but it cannot last forever. Sooner or later, sales have to grow.
Dividend growth tells you how confident management is. When the raises slow down, dig in. Sometimes it is prudence ahead of a storm. Sometimes it is a structural crack.
The relationship between the three matters most. I do not like seeing earnings grow 4% while the dividend jumps 8% to 10% a year. That pushes the payout ratio higher every year, and it does not last. In a perfect world, all three grow at the same pace. Easier said than done.
That one chart covers about 80% of the work.
Understand: build your conviction
The first part was about numbers. I look at the numbers before I fall in love with the story. Numbers speak louder than words.
Once the numbers make sense, it is time to understand what I am about to own. Before I click buy, I write down my investment thesis. That is my tool for conviction. Once you have looked at a business from every angle, you stop checking the market every day.
Here is my test. You should be able to explain the good and the bad of a business to a 12-year-old. If you can’t, you do not understand how the company makes money or what could break it.
Write the bull case (Costco Case)
Your thesis is the list of reasons you like the company. Break it into three blocks.
Playbook. How does it make money? The structure, the core products, the operational edge. Costco sells staples in bulk at thin margins and collects membership fees. Over 70% of operating income comes from those fees. That makes revenue predictable and keeps customers loyal.
Growth vectors. What drives future revenue and earnings? Costco continues to expand overseas, with strong results in Asia. Its e-commerce and same-day delivery are gaining ground. It keeps opening warehouses in North America. The map is not full yet.
Economic moat. Why can it defend its share and its margins? Costco’s moat is cost leadership and loyalty. Renewal rates top 90%. Its scale lets it squeeze suppliers and pass the savings on, which protects its reputation for low prices.
Write the bear case (Costco Case)
Every company has a downside. Writing it out helps you stay calm when the stock drops, because you will know whether the market is wrong or the business is. Break the risks into three blocks.
Business vulnerabilities. The internal cracks. Costco leans on physical traffic and a narrow product range. A supply chain shock or cost inflation could compress margins fast. The stock is also priced for perfection. Miss a quarter and it can fall more than 20% in a year.
Industry and market threats. Zoom out. A long stretch of high inflation could erode Costco’s pricing edge. Wage inflation could pressure its cost base more than that of rivals that outsource labor.
Competitive landscape. Who is gaining or losing ground? Walmart and Amazon press on grocery and e-commerce. This block is also where you might find a better idea. Study Costco against Walmart and you may decide Walmart is the stronger buy.
Dividend safety is dividend growth
Now the question that matters most. Will I get paid, and will my paycheck grow every year?
For me, dividend safety and dividend growth are the same thing. A safe dividend has to rise. If a company can’t raise its payout, the dividend is already low quality.
Picture retiring in 2006 on a portfolio paying $30,000 a year. Now, picture that payment never moving. To buy today what $30,000 bought back then, you need about $49,581. A frozen dividend is a 40% cut to your lifestyle.
The first check is a healthy dividend triangle. Then look at how the dividend has climbed year after year, and watch the payout ratio over time. If earnings grow as fast as the dividend, the payout ratio holds steady. That is the goal.
When the numbers leave a gap
The dividend triangle and the standard metrics answer most of your questions. Sometimes you finish and still have a gap. A number that makes no sense. A trend you can’t explain.
That is not a problem. It is a signal worth following.
Before you move to valuation, ask yourself five questions:
- Do I understand where the revenue comes from and why customers pay for it?
- Can I explain why the earnings trend looks the way it does?
- Do I know the main competitors and why this company wins or loses against them?
- Is there anything in the debt or balance sheet I cannot explain?
- Has anything changed in the last two years that the numbers have not caught up to yet?
If you answer “no” or “not sure” to any of them, that is where your next 20 minutes go. Start with cash flow from operations, free cash flow, long-term debt, and the payout ratio. Then read the financial statements until you have a clear answer.
Take action: valuation is context, not the trigger
Valuation is not the trigger. It is the context.
The best business in the world bought at a crazy price will lag for years. A solid business bought at a fair price compounds. That is the whole game. Not the cheapest stock. A quality business at a fair price.
Here is the hard part. You will never know for sure whether the price is too high or too low. Fancy models can boost your confidence, but they all run on assumptions. Plenty of the stocks I bought at all-time highs and “ridiculous” valuations turned into my best performers.
I use two checks to add context. They make valuation feel less like astrology.
Price-to-earnings against its own history. Compare today’s P/E to the company’s average over the past 5 to 10 years. Not the market. Its own record. If a name usually trades at 18 times earnings and sits at 14, that is a possible entry. If it trades at 26 with no change in growth, you are paying up for nothing.
Always ask why the discount exists. The business or the environment might be changing. BlackBerry once traded under 8 times earnings, with no debt and $4 billion in cash, right before the iPhone buried it.
Dividend yield against its own history. Same logic. If a stock typically yields 2.5% and now yields 3.5%, its price has fallen relative to its dividend. If nothing changed in the business, you may be looking at a fair entry.
Together, these two give you a clear yes-or-no answer without a spreadsheet.
Then there is the waiting trap. Holding out for the perfect price is one of the most expensive habits in investing. If the business is strong, the thesis is solid, the risks are clear, and the valuation is reasonable, the move is usually to start a position.
You do not need to buy the bottom to make money. You only need to avoid a price that makes a good return almost impossible. Stop using uncertainty as an excuse. There will always be uncertainty. Great companies survive, adapt, and thrive anyway.
Full Process in Only Three Parts!
You now have a full stock analysis process in three parts: identify, understand, take action.
It is not the most sophisticated method out there. It works, you can run it in one to two hours per stock, and it has held up through every market I have seen in the last decade.
The investors I have watched win over the long run do not own the best spreadsheets or the fastest news feeds. They follow a repeatable process, stay calm when markets turn emotional, and let the numbers lead instead of the headlines.
Process beats instinct. Numbers beat narratives. Conviction beats hope.
One last note before I let you go. You will make mistakes. You will hold losers. Once you accept that and start judging your portfolio as a whole rather than 30 separate bets, investing gets a lot more fun.
Skip the Screening and Start With 300 Strong Candidates
Finding companies with a strong dividend triangle takes time. I built the Dividend Rock Stars List to give you a head start. It tracks about 300 dividend stocks with growing trends, already sorted so you can spot buy candidates faster.
Enter your name and email below and I will send the instant download straight to your mailbox.


Leave a Reply