
Debt isn’t your enemy. Mismanaged debt is.
If you’ve followed me for a while, you know I’m comfortable with risk when it’s smart. Leverage, used well, is how capital-intensive businesses build assets that throw off cash for decades. Utilities, pipelines, and telecoms cannot sit around waiting for cash flow to fund projects. They borrow, build, and get paid back through long-lived assets. When management allocates capital wisely, that extra cash often shows up where we like it most: dividend growth.
But here’s the truth no one likes to read about: if interest becomes a headwind, bad things follow. Layoffs. Margin squeezes. Sometimes dividend cuts. That’s why you don’t skip debt ratios. You read them, understand what they say about flexibility, and pair them with the Dividend Triangle—revenue, earnings, dividend growth—to separate durable growers from dividend traps.
Liquidity: Can This Business Pay Its Bills Without Scrambling?
Liquidity ratios measure whether a company can afford to keep doing business. It determines the company’s ability to pay its current debt obligations without raising external capital (e.g., issuing shares or incurring additional debt). It’s pretty much the same as you looking at your bank account balance before going to the restaurant. You know whether you can afford the rack of lamb with a nice Cabernet Sauvignon or if you must settle for an avocado salad with a glass of sparkling water.
Current Ratio
Commonly used, the current ratio determines the financial strength of a company’s balance sheet. Does it have enough assets to get through the quarter? Comparing a company’s current assets with its current liabilities quickly shows if there’s a short-term problem. I used the current ratio often during the 2020 market crash, to make sure companies in my portfolio had sufficient assets to get through the lockdown.
Current Assets / Current Liabilities
Above 1 means a short-term cushion. Well below 1 can flag pressure ahead. Way above 1 can also mean idle assets that aren’t compounding.
Quick Ratio
The quick ratio is of great use during challenging times. It tells you if the company has enough cash or cash equivalents to pay its bills “at the end of the month”. Just like looking at your bank account and emergency fund to know if you can pay your mortgage, car payment, taxes, and utility bills. Unlike the current ratio, the quick ratio formula discards inventory on hand; it’s easy to be too generous with the inventory book value when things are going badly.
(Current Assets – Inventory) / Current Liabilities
Strips out inventory optimism. Over 1 is fine. Over 1.5 is comfy. Under 1 means the company needs sales, fast, or it taps credit.
Cash Ratio
The cash ratio is straightforward but restrictive. It shows if the company has enough cash on hand to cover short-term liabilities. However, it focuses too much on cash, ignoring other assets that can help bad situations. In challenging times, you don’t only count what’s inside your wallet. You look to other resources you can use, assets you can sell, or people you can call to raise cash. The same applies to a business.
Cash and equivalents / Current Liabilities
The strict test. Below 1 isn’t a panic button, but it tells you to find other cash sources and confirm credit access.
Bottom line: In rough patches, I want companies that can ride out a few bad quarters without issuing shares or slashing the dividend.
Leverage: How is Long-Term Debt Structured?
The Leverage ratio is also called the Solvency ratio. When you look at the leverage ratio, you will not find a clear answer. As I mentioned in my introduction, leverage could end up being good or bad.
Leverage ratios must be put into context, and they will tell you a story of how the company has structured its long-term debt. Is it a good choice or a bad choice? It depends on each situation and industry. What I find useful when examining these ratios is understanding the context in which a company is likely to experience financial problems.
Debt Ratio or Debt to Assets Ratio
Dividing a company’s long-term debt by its total assets indicates the strength of its balance sheet, and whether the company has gone into too much debt compared to the assets it has.
(Long-Term Debt + Current Portion of Long-Term Debt) / Total Assets
Below 1 is preferable. Above 1 signals heavy leverage relative to assets. Zero debt can be fine, but in capital-heavy models, zero can also mean missed growth.
Debt to Equity Ratio
I like the debt-to-equity ratio; it tells the story of whether a company uses leverage or not to finance its projects. Some companies prefer to use equities and have a lower debt to equity ratio, while others prefer the leverage offered by debt.
Total Liabilities / Total shareholders equity
There’s no perfect ratio here. Compare a company’s ratio to its industry and put it in context. Higher often means aggressive debt-funded growth and more volatile earnings. Lower usually means sturdier.
Financial Debt to EBITDA
This ratio compares the financial debt to earnings before interest, taxes, depreciation, and amortization (EBITDA). Financial debt refers to the amount a firm owes that isn’t related to its day-to-day operations. It shows the relation between the company’s debt and its profit.
Financial Debt / EBITDA
Above 1 is normal. Direction matters. Rising quickly? Ask why. Flat to down while earnings rise? That’s what we want.
Credit Ratings: Useful Shortcut, Not a Verdict
When available, ratings from S&P, Moody’s, and Fitch are forward-looking opinions about the ability to meet obligations. Investment grade begins at BBB-/Baa3.
Upgrades lower borrowing costs; downgrades raise them.
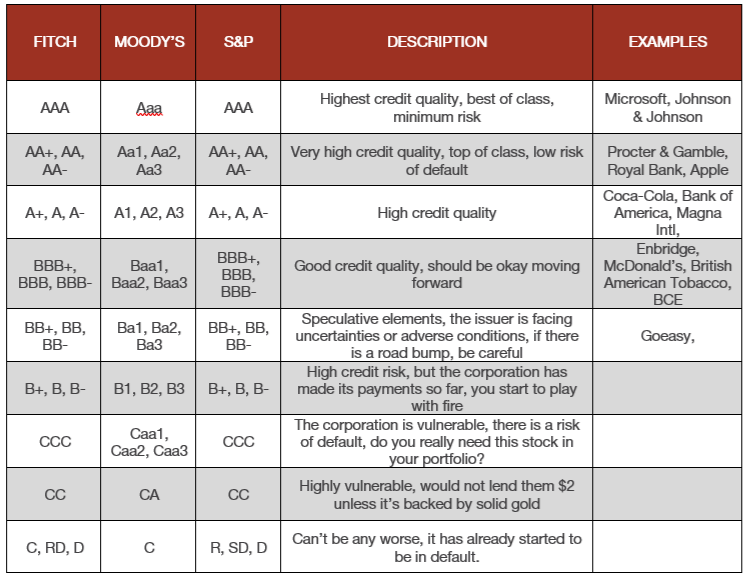
Read the rationale, then go back to the business model, maturities, and the Dividend Triangle. Numbers matter. Context wins.
What’s Good? What’s Bad?
Do not look at debt ratios in isolation. A high debt ratio could mean the company is going into very promising projects, such as acquisitions, or that it borrowed too much and is facing financial difficulties.

What do I do? —> I compare debt ratios for a few companies in the same industry and add context to explain them. I believe it’s more important to understand how a company is structured than to only look at the numbers.
Sustained high debt levels make it difficult to maintain a dividend growth policy. If you don’t find growth across the dividend triangle, chances are debt will become a burden.
Your 5-Step Checklist
-
Start with liquidity: Current and Quick ratios.
-
Scan solvency: Debt/Assets, Debt/Equity, Debt/EBITDA.
-
Check credit rating and any outlook changes.
-
Overlay the Dividend Triangle: revenue, EPS, and dividends trending up together.
-
Read the story: what projects are funded, what is the payback path, how is maturity risk managed?
Want names that already pass this test so you can act with confidence?
Download the Rock Star List to see around 300 dividend growth stocks ranked on business health with easy filters for yield, payout, and growth so you can find the right fit faster.


Leave a Reply