

In 2016, I made a life-changing decision: I took a sabbatical, put my family in a small RV, and we drove all the way to Costa Rica.
Upon my return in 2017, I officially quit my job as a private banker at National Bank and started working full-time on my baby: Dividend Stocks Rock. I also decided to manage my pension account held at the National Bank. I’ve built and managed this portfolio publicly since 2017 to create and track a real-life case study.
In August 2017, I received $108,760.02 in a locked retirement account. Locked means I can’t add capital to the account, and growth is only generated through capital gains and dividends. I don’t report this portfolio’s results to brag about my returns or to suggest you follow my lead. My purpose was solely to share with our members how I manage my portfolio with all the good and the bad that inevitably takes place each month. I hope you have learned and will continue to learn from my experiences managing this portfolio.
Annual Portfolio Checkup
2025 is almost over and it’s time to look at my investments closely! I prematurely started the work when I trimmed my Apple (AAPL) shares last month to buy some Broadcom (AVGO) This was a move I should have done ages ago!
However, the year-end portfolio review process is a lot more than a trade here and there. It’s a complete operation across all my portfolios to ensure all my investments are aligned with my strategy. This is how you reach conviction and sleep well at night. But first, the results!
Performance in Review
Let’s start with the numbers as of November 5th, 2025 (before the bell):
Original amount invested in September 2017 (no additional capital added): $108,760.02.
- Current portfolio value: $322,825.69
- Dividends paid: $5,278.71 (TTM)
- Average yield: 1.63%
- 2024 performance: +26.00%
- VFV.TO= +35.24%, XIU.TO = +20.72%
- Dividend growth: +12.22%
Total return since inception (Sep 2017- October 2025): +196.82%
Annualized return (96 months): 14.57%
Vanguard S&P 500 Index ETF (VFV.TO) annualized return (since Sept 2017): 16.81% (total return 246.50%)
iShares S&P/TSX 60 ETF (XIU.TO) annualized return (since Sept 2017): 12.27% (total return 152.50%)
Year-End Portfolio Review Process
#1 Set the mandate
Going back to the reason why you invest is crucial to cut down on all the noise. You may have a fear of missing out (FOMO) on the AI bull market, or you may regret not buying gold or Bitcoin. But if it’s not part of your strategy, why would you suffer from FOMO? The goal of investing is to reach your financial goals, not to play Monday morning quarterback.
My goal is to build a portfolio of dividend growth stocks that will support my retirement. I value control (owning stocks) and knowledge (understanding each company’s business model) over outperforming the market. It’s great to keep up with indices, but my goal is to own a basket of high-quality companies.
#2 Review asset, sector and stock allocation
Now that you are set with your investment goal, it’s time to review your allocation rules. The rule itself isn’t that important because we could argue all day about the ideal weight of a position in a portfolio. The point is to have guidelines. In other words, it doesn’t matter if you have set your limit to a sector at 20% or at 26.5%. What matters is that you have a limit that will trigger an action.
That’s how you get rid of hesitation: with easy-to-follow rules.
I want to be fully invested 100% in stocks. In an ideal world, my investment would not exceed 20% in a sector. However, I can accept going up to 30% if I’m invested in different sub-sectors (industries) that don’t have much interaction with each other.
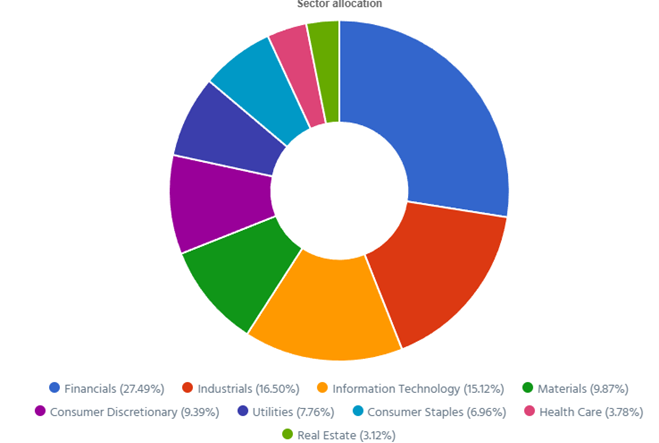
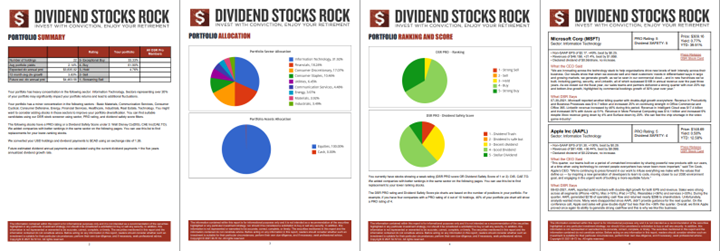
Using my DSR PRO global view, I can quickly combine all my portfolios and see my global sector allocation:
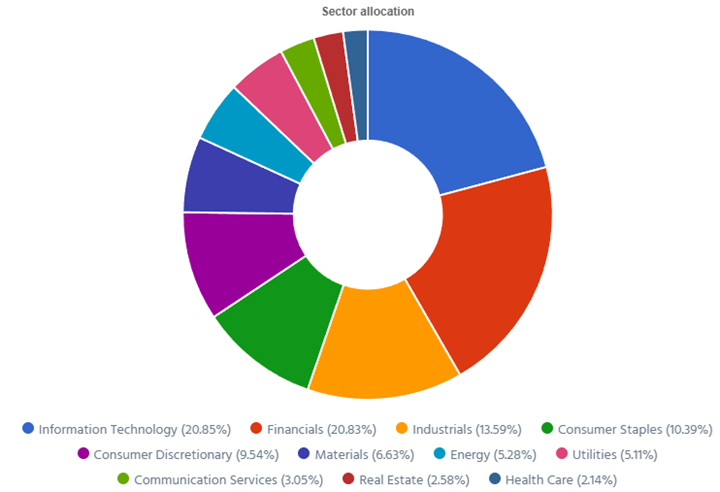
As you can see, I’m putting my money where my mouth is. The portfolio is well diversified with 2 sectors at 21%.
The last step of the allocation review is to look at my largest and smallest holdings. The point is to limit my exposure to risk (largest positions) and to ensure I don’t monitor stocks for nothing (smallest holdings). The ideal position weight is also used as a guideline to act. If you are happy at 2% and your neighbor is happy at 4%, both of you are right and happy. Period.
In an ideal world, all my p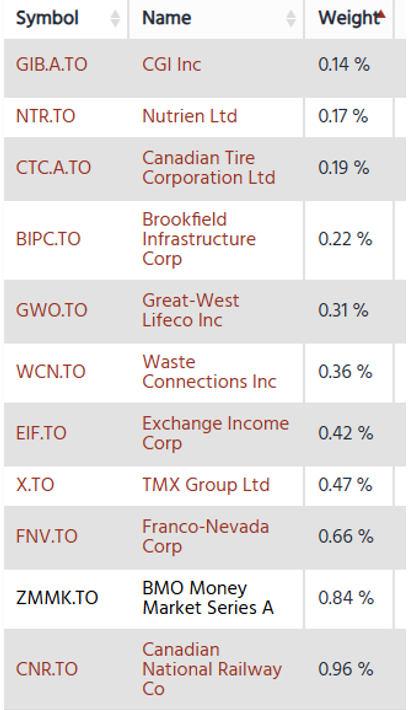 ositions would be around 3%. I also have a rule to let my winners run. Therefore, I will not trim or sell stocks that are performing well and account for up to 10% of my investments. Over time, I realized that the creation of my Smith Manoeuvre portfolio has added small positions that I don’t hold anywhere else. That pushed my number of stocks to 39 with a few insignificant positions.
Upon review, I will perform a clean-up in my Smith Manoeuvre portfolio at the end of the year to reduce the number of smaller holdings.
I will review each holding and determine whether I want to build a full position (bringing it to 3%) or if I prefer to sell and move on.
Note that this analysis doesn’t consider the stock performance. Changes are made at a higher level to ensure a cleaner portfolio.
#3 Analyze weaker positions (dividend triangle)
Before reviewing any investment thesis and narrative, I perform a screen using the dividend triangle. I’m looking at companies struggling to generate revenue or EPS growth (companies like Alimentation Couche-Tard, for example). I will also take a closer look at companies with a smaller dividend increase than usual (companies like Home Depot and Starbucks are on this short list).
Since I review my portfolio quarterly using the DSR PRO report, I already have a very good idea where to start. I’m not going to do a deep dive on all my stocks. Just the ones with a weaker dividend triangle or with a weak PRO & Dividend Safety Score.
#4 Trade
Armed with my buy list and smaller stocks I want to bring to a higher level; I will redeploy my capital within minutes. I don’t need to track stock price, technical trends, and other indicators. I’m investing for 40+ years.
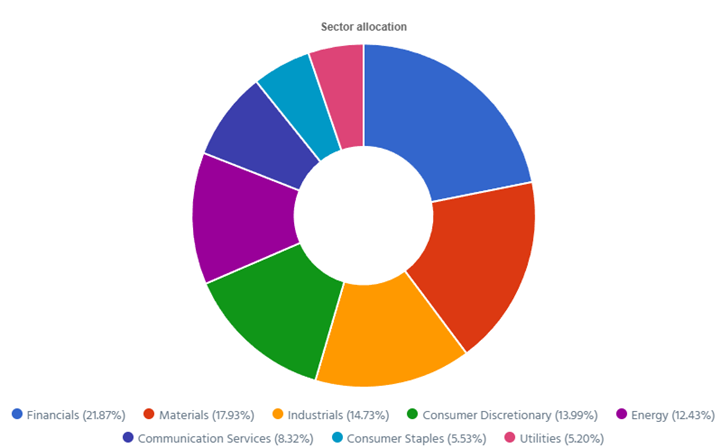
Smith Manoeuvre Update
Slowly but surely, the portfolio is taking shape with 14 companies spread across 8 sectors. My goal is to build a portfolio of thriving companies with a solid dividend triangle (e.g. with positive revenue, EPS and dividend growth trends). The current portfolio yield is at 3.02% with a 5-year CAGR dividend growth rate of 10.74%.
- The portfolio value is now at $25,803.37
- The portfolio debt is at $21,250.
- Monthly contribution is set at $750.
- The annual income is $779.60, and the projected income is $863.37
- To report my Smith Manoeuvre, I export the Excel data from my DSR PRO dashboard.
Smith Manoeuvre Portfolio Summary
Here’s my SM portfolio summary as of November 5th, 2025 (before the bell):
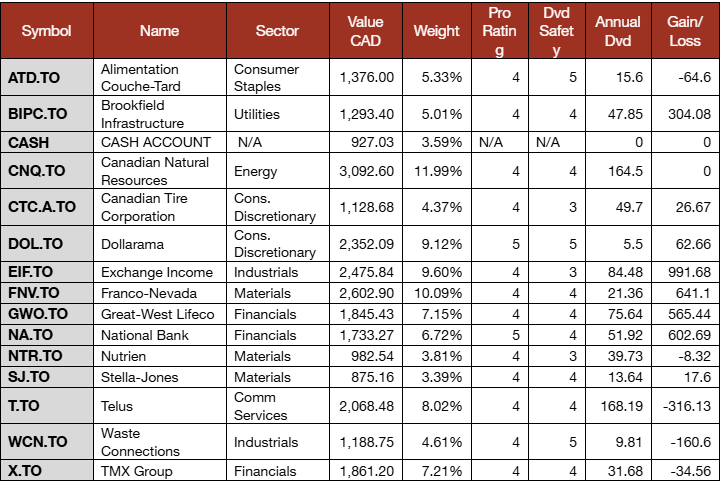
Adding more shares of Stella-Jones (SJ.TO)
As the portfolio is taking shape, it makes sense that I add to my smaller positions. SJ is now 3.39% of my portfolio. I will use my contribution + dividend (about $927 in my cash account) to add a few more shares. The company reported a good quarter with EPS up 12%. Not bad for a stock going nowhere in 2025. It may be a good time to dollar-cost-average!
Pension Portfolio Summary
Here’s my pension plan portfolio summary as of November 5th, 2025 (before the bell):
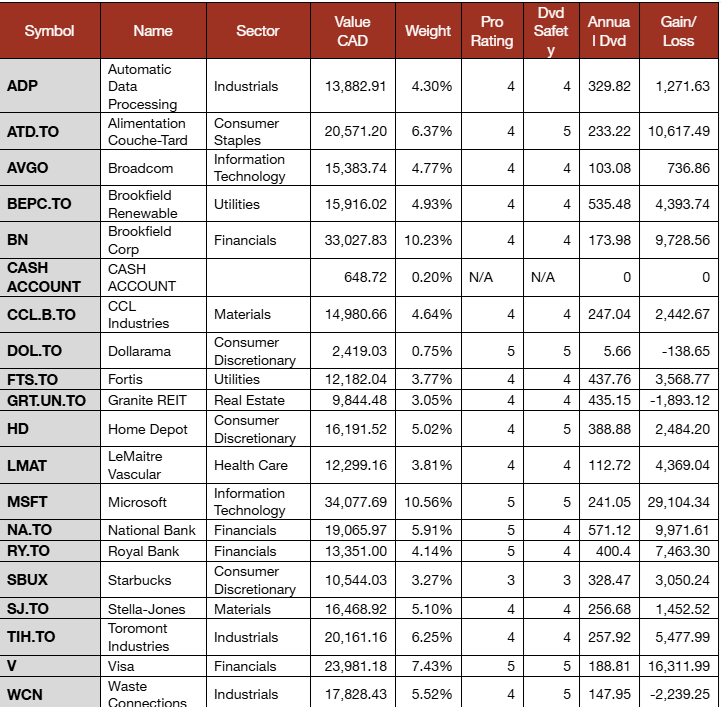
Total value: $322,825.69. $320,936.00 (+$1,889.69 or +0.59% from last month).
Several companies reported earnings in the past 30 days! Let’s have a look!
Automatic Data Processing prints strong results
Automatic Data Processing reported a solid quarter with revenue up by 7.5% and EPS up by 7%, which beat analysts’ expectations. Employer Services and PEO Services were up 7%. Management cited solid new business bookings growth, robust client revenue retention, and higher client funds interest as key drivers. The company maintained its fiscal 2026 outlook for revenue growth of 5% to 6%, adjusted EBIT margin expansion of 50 to 70 basis points, and adjusted diluted EPS growth of 8% to 10%.
Yet, the stock price is going down and there might be a good opportunity here?
Brookfield Renewable generates double-digit FFO growth
Brookfield Renewable reported another strong quarter with FFO per share up by 10%. Hydro delivered FFO of $119M on solid Canadian and Colombian generation and better U.S. pricing. Wind and Solar combined generated $177M of FFO with growth from Neoen, Geronimo Power and U.K. wind offset by prior-year asset sales. Distributed energy, storage and sustainable solutions contributed $127M, benefiting year to date from Westinghouse and Neoen despite the prior sale of pumped storage and timing of Westinghouse orders. Segment trends and stronger commercial activity were the principal drivers of the mixed top-line result.
Here is a recent video about Brookfield Renewable (BEP) Earnings
Fortis spends a lot and rewards shareholders
Fortis reported another good quarter with EPS up 2.4% and a 52nd consecutive dividend increase (+4.1%). Management attributed the revenue increase of 6% to ongoing rate base growth across the utilities, higher flow-through costs in customer rates, higher customer delivery rates at Central Hudson, and a stronger U.S. dollar. Fortis completed the sale of FortisTCI in September and closed the sale of its Belize assets in October, with proceeds earmarked to strengthen the balance sheet and fund the capital plan. The new 2026–2030 capital plan totals $28.8B (+$2.8B from the prior plan) and is expected to lift the mid-year rate base from $41.9B in 2025 to $57.9B by 2030 (7% CAGR).
Microsoft is just incredible
Microsoft impresses again with revenue up by 18% and EPS up 25%, which easily beat analysts’ expectations. By segment, Productivity and Business Processes were up 17%, Intelligent Cloud was up 28% with Azure and other cloud services up 40%, and More Personal Computing produced a 4% increase. Management attributed growth broadly to continued cloud and AI momentum with commercial remaining performance obligation rising 51% to $392B, indicating robust multi-year demand. Microsoft continued to invest aggressively in AI capacity, with external reporting noting approximately $34.9B of quarterly capital expenditures to expand data centers and AI infrastructure as demand accelerates.
Starbucks is not going “Back to Starbucks” fast enough
Starbucks reported another mixed quarter where revenue increased by 5.5%, but EPS fell off a cliff at -35%. North America revenue was +3% to $6.9B as flat comps and a modest ticket increase were offset by portfolio pruning and weakness in licensed stores. International was up 9% on positive comps and store growth led by China, Japan, the U.K. and Mexico. SBUX has agreed to sell a majority stake (60%) in its China business to Boyu Capital for $4B. The non-GAAP operating margin contracted 500 basis points to 9.4%, reflecting restructuring and impairment charges tied to coffeehouse closures and organizational simplification as part of the “Back to Starbucks” initiative. I’m seriously considering selling my shares at the end of the year, when I review my investments.
Stella-Jones expands its utility poles business
Stella-Jones reported a good quarter with revenue up 5% and EPS up 12%. Growth was driven primarily by higher volumes in utility poles and industrial products and by price improvements in railway ties and residential lumber. This was partly offset by lower spot pricing in utility poles and a 47% decline in logs and lumber. The EPS improvement was supported by higher operating income and lower financial expenses. SJ also announced the acquisition of Brooks Manufacturing for $140M which broadens its utility product portfolio and reinforces its position with electric utilities.
Toromont Industries boosts backlog by 47%!
Toromont Industries reported a mixed quarter as revenue declined by 2%, but EPS jumped by 8%. The Equipment Group declined 4% on lower new equipment sales in mining against a tough comparison, partially offset by higher power systems, rentals were up 5% on better utilization and fleet and product support was up 4%. CIMCO grew 22%, driven by a 28% increase in package revenue as project execution improved and delivery schedules normalized with product support up 14% on solid Canadian market activity. Consolidated bookings rose 47% and backlog ended the quarter at $1.3 billion due to strong order intake and contributions from the AVL acquisition.
Here is a recent video about Toromont, TMX, Fortis and Franco Nevada
Visa -> Business as usual
Visa reported another solid quarter with revenue up 11.5% and EPS up 10%, beating analysts’ expectations. Results were supported by key drivers, including payments volume being up 9% in constant dollars, total cross-border volume up 12%, and processed transactions up 10%. Revenue mix showed service revenue of $4.6B (+10%), data processing revenue of $5.4B (+17%), international transaction revenue of $3.8B (+10%), and other revenue of $1.2B (+21%), partially offset by client incentives of $4.248B (+17%). The top-line increase was fueled by resilient consumer spending and healthy travel and e-commerce cross-border activity. Visa also increased its dividend by 13.6%!
Waste Connections lets you collect more dividends!
Waste Connections reported a mixed quarter as revenue increased by 5%, but EPS declined by 7%. Management’s stats show solid waste internal growth driven by 6.3% core price offset by a 2.7% volume decline and an 0.8% recycling headwind reflecting resilient pricing with softer activity and lower commodity values. Earnings were affected by $60.1 million of impairments and other operating items, including a write-down of contracts, a non-operating E&P waste facility permit, and an environmental liability. Adjusted EPS was up by 7%. WCN raised its dividend by 11% and completed repurchases totaling about 1% of shares outstanding.
My Entire Portfolio Updated for Q3 2025
Each quarter we run an exclusive report for Dividend Stocks Rock (DSR) members who subscribe to our very special additional service called DSR PRO. The PRO report includes a summary of each company’s earnings report for the period. We have been doing this for an entire year now and I wanted to share my own DSR PRO report for this portfolio. You can download the full PDF showing all the information about all my holdings. Results have been upd0ated as of September 10th, 2025.
Download my portfolio Q3 2025 report.
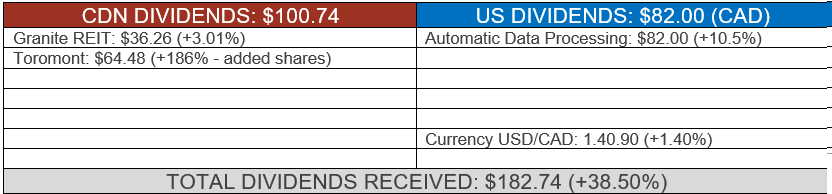
Dividend Income: $182.74 (+38.5% VS. OCTOBER 2024)
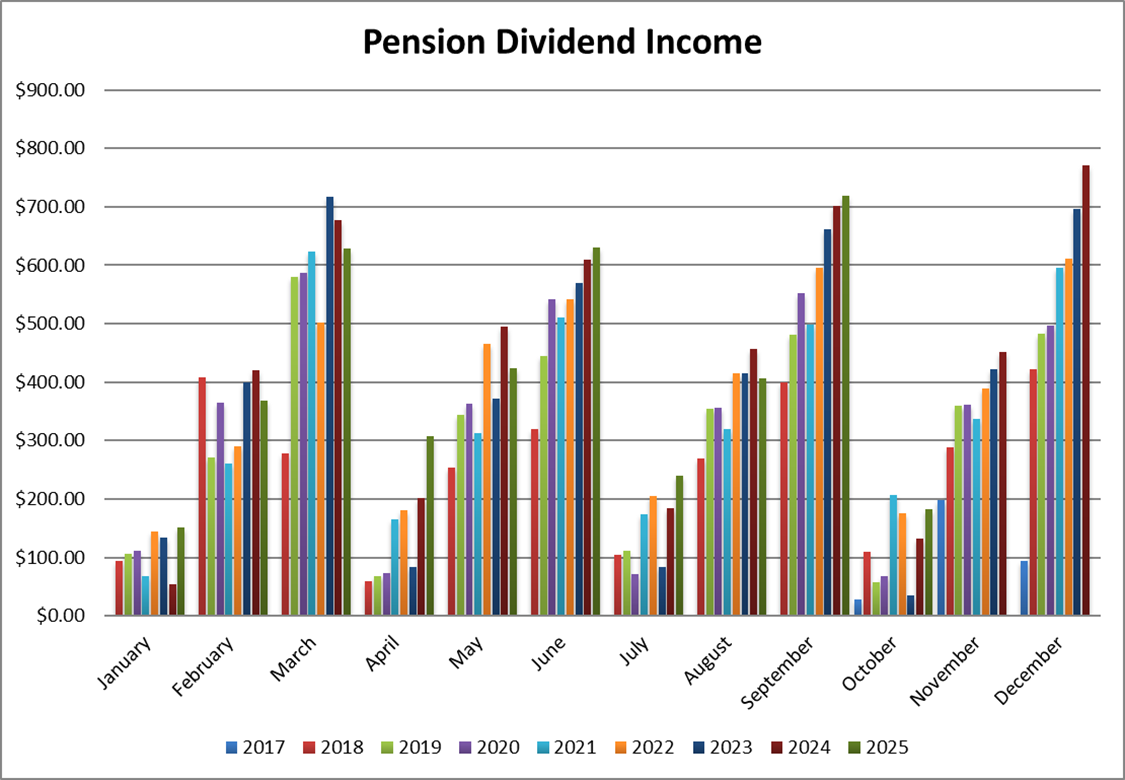
September was a juicy month with several dividend payments. I also added more shares of CCL and SJ to boost the payouts. The currency factor was also on our side at +4%!
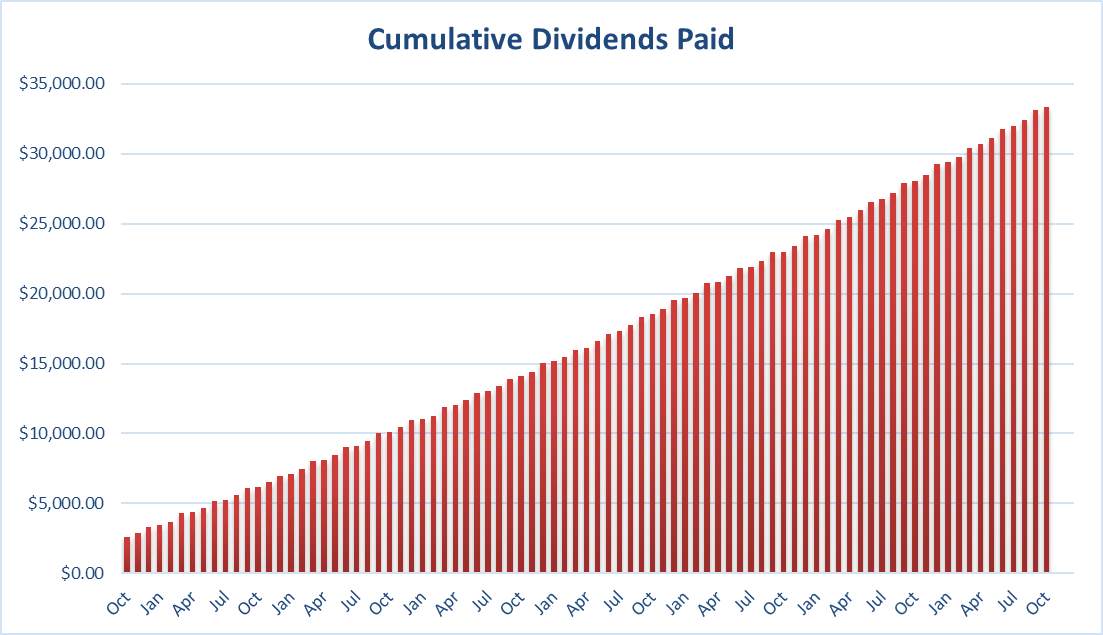
Since I started this portfolio in September 2017, I have received a total of $33,323.61 CAD in dividends. Keep in mind that this is a “pure dividend growth portfolio” as no capital can be added to this account other than retained and/or reinvested dividends. Therefore, all dividend growth is coming from the stocks and not from any additional capital being added to the account.
Final Thoughts
After another bad quarter from Starbucks, I’m adding a note to consider selling the stock during my year-end review. Following my investment rules: SBUX doesn’t follow my investment thesis anymore (I had great hope for growth in China) and the dividend triangle is getting weaker with mediocre revenue growth, free-falling EPS and a poor dividend increase of only 1.6%. It looks like I’ll have enough money to build Dollarama into a full position very soon!
In the meantime, I stay fully invested.
Cheers,
Mike.


Leave a Reply