

In 2016, I made a life-changing decision: I took a sabbatical, put my family in a small RV, and we drove all the way to Costa Rica.
Upon my return in 2017, I officially quit my job as a private banker at National Bank and started working full-time on my baby: Dividend Stocks Rock. I also decided to manage my pension account held at the National Bank. I’ve built and managed this portfolio publicly since 2017 to create and track a real-life case study.
In August 2017, I received $108,760.02 in a locked retirement account. Locked means I can’t add capital to the account, and growth is only generated through capital gains and dividends. I don’t report this portfolio’s results to brag about my returns or to suggest you follow my lead. My purpose has been solely to share with our members how I manage my portfolio with all the good and the bad that inevitably takes place each month. I hope you have learned and will continue to learn from my experiences managing this portfolio.
My Lira 9 Years Later
9 years ago, I made two big decisions:
- I quit my private banker job without a safety net to work full-time on DSR.
- I took the value of my pension plan and invested it all in an all-time high market.
Looking back, both were exceptionally great financial decisions.
But first, the results!
Performance in Review
Let’s start with the numbers as of September 4th, 2026 (before the bell):
Original amount invested in September 2017 (no additional capital added): $108,760.02.
- Current portfolio value: $339,595
- Dividends paid: $5,442.55 (TTM)
- Average yield: 1.60%
- 2025 performance: +7.34%
- VFV.TO= +12.18%, XIU.TO = +28.88%
- Dividend growth: +1.5%
Total return since inception (Sep 2017- Sep 2026): +212.24%
Annualized return (107 months): 13.62%
Benchmark: 15.12%
Out(under)performance: -1.50%
Vanguard S&P 500 Index ETF (VFV.TO) annualized return (since Sept 2017): 16.51% (total return 290.70%)
iShares S&P/TSX 60 ETF (XIU.TO) annualized return (since Sept 2017): 13.74% (total return 215.20%)
I remember the Bank offered me such a small pension that keeping my pension plan with them was a no-brainer, so transferring the money into a LIRA was the right move.
You must always run the calculations to compare the pension vs. the LIRA option.
In my case, I had to generate about a 3% return annually to reach the pension they secured at 65. In only 9 years, I could leave my LIRA in a money market fund for the next 20 years and I would still be ahead of that pension!
This highlights how important it is to stick to a strategy and forget about “where are we in the market cycle”. Technically, 2017 was close to the end of a bull market. All indicators pointed to a bear market.
And the bear market happened in 2018
I only had my money invested a few months before the 2018 bear market hit in July of 2018. The strange thing about a bear market is that you don’t know you are in it right away. At first, you have a bad month. It’s summer, volumes are low, it’s probably just a small dip. Then the bad month turns into a bad quarter and eventually, the bear market materializes after reaching a drop of 20% from the top of that market cycle.
Even if 2017 was the end of the bull market, even if I invested at an all-time high, even if 2018 was a bear market, at no point did my LIRA go under its original amount.
Therefore, the best time to invest my money was… “today”.
Here is a video on 4 factors that could lead us to a bear market:
Fast forward to today
For over 7 years, I beat my benchmark (50% US and 50% Canadian market). But it’s been about a year that I’m underperforming.
See Mike, your strategy is not bulletproof!
Wait… underperforming doesn’t mean poor returns. In fact, chasing returns and trying to beat the market every year is a fool’s game. It may lead to taking unnecessary risks that you may regret.
But Mike, you would have been better off investing in indexes
Ah! Good old hindsight, right? As I mentioned, if I had paused my investment strategy each year to determine what works best. I would have kept dividend growth investing 8 of the past 9 years.
But I would have doubted each year to know which strategy is best.
The reason why I pick stocks is not to beat the market. It’s to increase my level of conviction.
- I know exactly what I have in my portfolio.
- I know why it goes up, why it goes down.
- I’m the only one deciding when to buy and when to sell.
- At retirement, I can create the income I need, not the income a firm wants to pay me.
Dividend Growth Investing works long-term, but fails to impress
I’ve been investing for 23 years now. One thing I notice is that my first years of investing were a lot more impressive and even got me two interviews (in the Globe & Mail and in Canadian Business).
However, I sleep better and show more consistent results since I switched to dividend growth investing in 2010. 16 years in the same strategy, I’ve gone through all kind of markets without having to be worried one bit about my stocks. That’s priceless!
I’ve made mistakes, but my good moves more than made up for them. That’s the beauty of investing: you don’t need to play for 1,000. If you have a good average, your portfolio will do well.
The biggest mistake is to switch strategy every 4-5 years based on what works now.
WARNING: HIGHER BOND RATES
There are lots of dark clouds over our heads right now. As the tariff war has more plot twists than a crime and heist book, I’ll let this one sit on the bench for this issue.
Anyway, there is a bigger storm forming in the bond market!
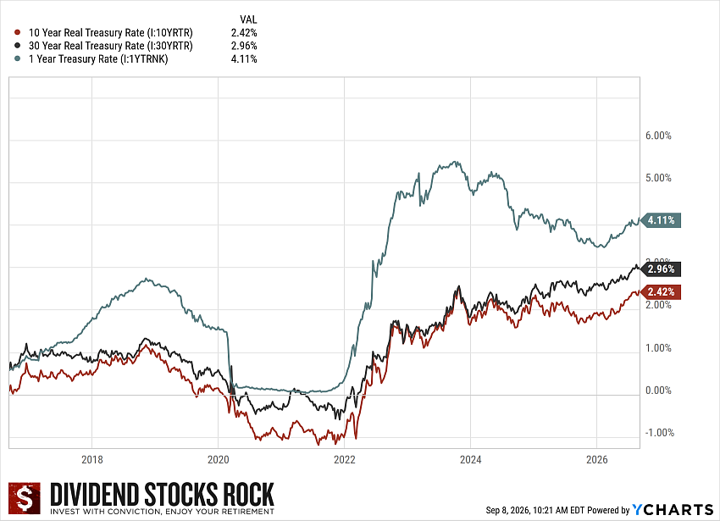
The year is not over yet, and I can already tell you that higher bond rates have a pretty good chance of being at the top of my investment themes for 2027.
Bonds are going higher for many reasons these days: wars, tariffs, government deficits, higher inflation and uncertainty in general. In other words: investors want to be compensated for a long list of current risks.
Long-term bond yields have moved higher creating a more normal upward-sloping curve. But “normal” doesn’t necessarily mean harmless.
The bigger issue today is that long-term borrowing costs are rising even while central banks may be considering, or already delivering, lower short-term rates.
That matters for investors.
Long-term bond yields are influenced by several forces: expectations for future central bank rates, inflation, economic growth, government borrowing, and what is called the “term premium.” The term premium is simply the extra return investors demand for locking up their money for 10, 20, or 30 years.
If investors become worried about inflation, government deficits, or massive amounts of new debt being issued, they may demand higher yields. Bond prices then fall, and yields rise.
Government bonds are the foundation of asset valuation
If a 10-year government bond yields 2%, investors are more willing to accept a 4% dividend yield from a utility, telecom, or REIT. But if government bonds suddenly yield 4% or 5%, those same stocks need to offer more attractive returns to compensate investors for taking additional risk.
That often means lower stock valuations
REITs, utilities, telecoms, and highly leveraged companies are particularly sensitive because they are hit twice. First, investors demand higher yields from their shares. Second, their own borrowing costs increase as debt matures and must be refinanced.
High-growth stocks are also vulnerable. Their valuations depend heavily on profits expected many years into the future. Higher discount rates reduce the present value of those future earnings, which can compress P/E ratios even when the underlying business continues to grow.
Banks are more complicated.
A steeper yield curve can help bank net interest margins because banks generally borrow at shorter maturities and lend at longer ones. However, if long-term rates rise too quickly, mortgage demand slows, corporate borrowing weakens, and credit losses can eventually increase.
Canada may be particularly sensitive because mortgages typically renew every few years. Even if the Bank of Canada lowers its overnight rate, fixed mortgage rates can remain elevated if Government of Canada bond yields stay high. So, the mortgage crisis might have been postponed from 2026 to the next few years.
The most important question isn’t simply whether bond yields are rising; it’s why
If yields rise because economic growth and productivity are strong, markets can usually handle it.
If yields rise because investors worry about persistent inflation, government deficits, excessive debt issuance, or fiscal credibility, that is a much tougher environment.
For dividend investors, the message is not to panic over every movement in the bond market. Instead, pay closer attention to debt levels, refinancing schedules, interest coverage, free cash flow, and valuation.
Higher long-term yields will put pressure on the cost of capital.
Higher government bond yields ? higher mortgage/corporate borrowing costs ? lower asset valuations ? slower investment/consumption ? eventually slower economic growth.
Your best shield
If one industry could benefit from higher bond rates, it’s life insurance companies. However, it’s not that simple since most of them now participate in wealth management. So, while their insurance portfolio will do well, their assets under management may take a hit if the market goes into bear mode.
Once again, your best bet is not to move all your money into one direction, but rather to double-check all your holdings to ensure you have robust companies with healthy balance sheets.
The DSR stock cards and ratings should help you focus on weaker positions in your portfolio.
At the end of this year, I will conduct a thorough portfolio review to make sure I’m still on the right path. You should do so too.
Smith Manoeuvre Update
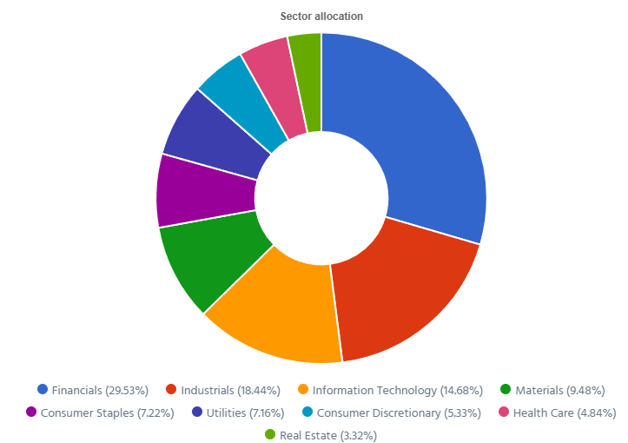
The portfolio shows 13 companies spread across 7 sectors. My goal is to build a portfolio of thriving companies with a solid dividend triangle (e.g. with positive revenue, EPS and dividend growth trends). The current portfolio yield is at 1.76% with a 5-year CAGR dividend growth rate of 11.74%.
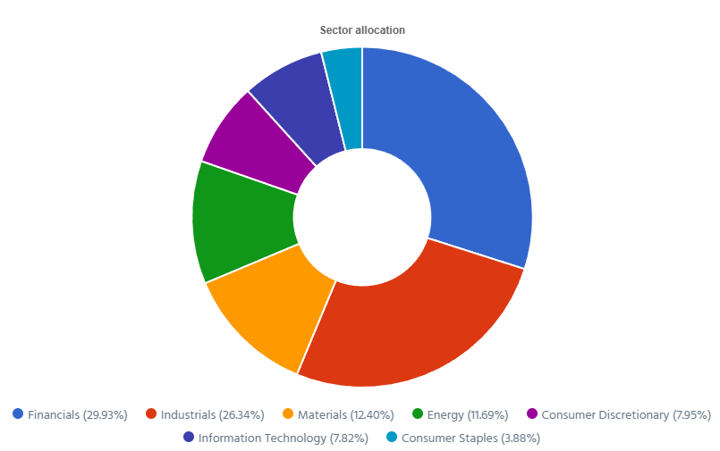
- The portfolio value is now at $42,282.17
- The portfolio debt is at $31,000.
- Interest paid since April 2022: $2,765.13
- Monthly contribution is set at $1,000/month.
- The annual income is $742.75, and the projected income is $829.95.
- To report my Smith Manoeuvre, I export the Excel data from my DSR PRO dashboard.
The portfolio is on its way towards generating an extra $1,000 per year in dividends. I’m not there yet, but it will happen in the first months of 2027! By then, my portfolio will be close to $50,000! That will be exciting to see a 13th influx of $1,000 to boost the portfolio further!
Smith Manoeuvre Portfolio Summary
Here’s my SM portfolio summary as of September 4th, 2026 (before the bell):
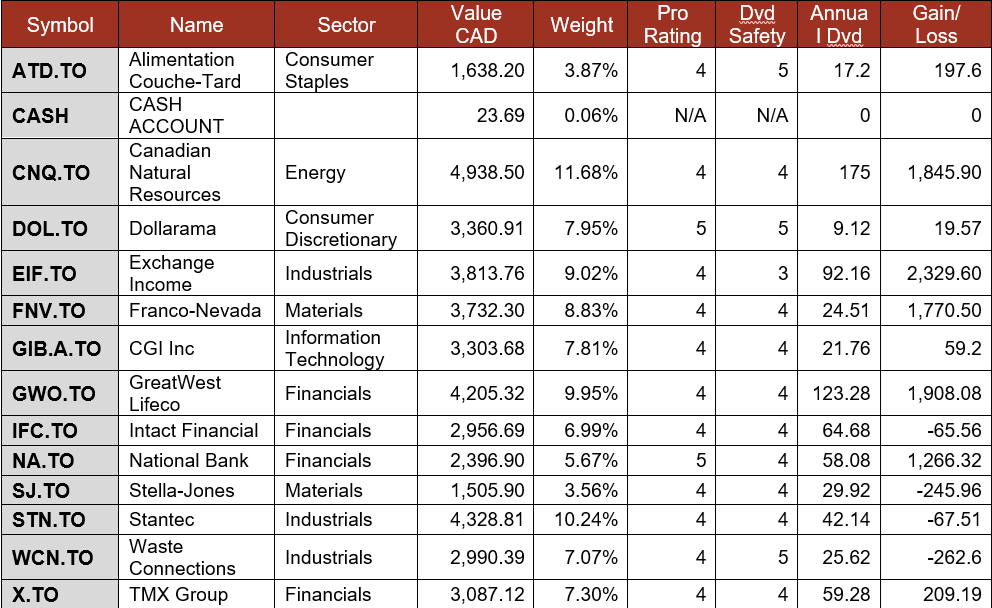
Bought more Stantec
As Stantec is going down, I will keep adding shares until I reach a full position. Ironically, it’s hard to reach a 3% weight when a stock is continuously losing steam! (But better watch it once it recovers)
Therefore, I’m filling up the truck with all the liquidity I have. STN’s dividend triangle remains incredibly strong for a stock losing a third of its value in the past 12 months!
Again, it’s all about focusing on the long-term!
Pension Portfolio Summary
Here’s my pension plan portfolio summary as of September 4th, 2026 (before the bell):
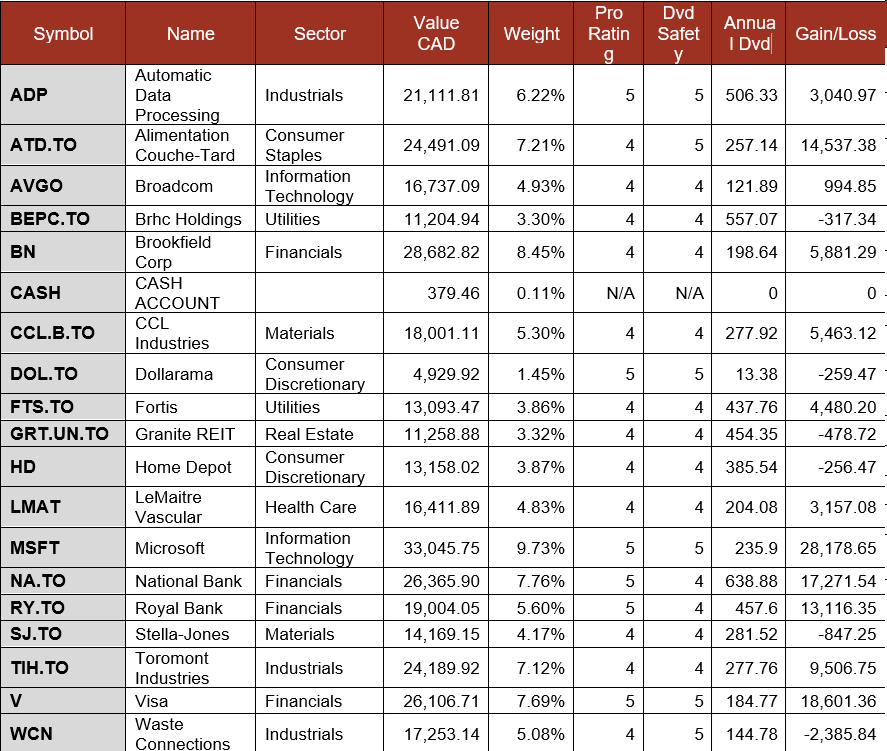
Total value: $339,595.12 (-$12,424.88, -3.5% from July).
Automatic Data Processing
Automatic Data Processing reported Q4 FY2026 adjusted EPS of $2.64, up 17%, on revenue of $5.47B, up 7%. For the full fiscal year, revenue reached $21.95B (+7%) and adjusted EPS hit $11.12 (+11%), both at the high end of guidance. New business bookings set a record at $2.2B, led by AI-powered HR and payroll tools. Employer Services grew 7% while PEO held steady. Management guided FY2027 for 5-6% revenue growth and 9-11% adjusted EPS growth. AI tools including ADP Lyric and ADP Assist are compressing client workflows and supporting margin expansion
Alimentation Couche-Tard
Couche-Tard reported a good quarter with revenue up 25% and adjusted EPS up 15%. Unfortunately, most of the revenue growth came from higher fuel sales (we know why!). Fuel revenue jumped 33% (volume was down, but prices were up!), while merchandise was only up by 4.1%. Same-store merchandise sales were up modestly (U.S. +1.7%, Europe +1.2% and flat in Canada). Couche-Tard reduced its merchandise margin (promotions) to stimulate sales. A big part of EPS growth is also coming from “monster” fuel margins (+19.6% in the U.S., +18.2% in Canada). Earnings were also supported by a modest increase in expenses (2.7%, below inflation) and share buybacks (about 3% vs. last year).
Here is more on Couche Tard ATD quarterly earnings:
Broadcom
Broadcom reported a record quarter with revenue up 86% and adjusted EPS up 96%. Results were driven by custom AI accelerators and AI networking. Semiconductor solutions revenue was $20.8B (+127%) as AI semiconductor revenue surged 221% to $16.7B, now 56% of total, while non-AI chips grew 5% to $4.2B. Infrastructure software was $8.8B (+29%). Gross margin slipped to 75% on the AI mix, but operating margin hit a record 67.9%. Management guided Q4 revenue to $34.8B (+93%) with AI revenue of $21.7B and expects AI revenue of $58B in fiscal 2026, $115B in fiscal 2027 and $230B in fiscal 2028. The stock fell 6% as Q4 guidance landed a touch below what the market wanted to hear.
Brookfield Renewable
Brookfield Renewable reported a strong quarter with record FFO of $421M and FFO per unit up 11%. Revenue came in at $1,710M, up from the prior year period driven by strong operating performance, asset recycling gains, and growth from new development. FFO per unit reached $0.62, reflecting the highest quarterly FFO in the company’s history. Management also announced a proposed corporate simplification plan to merge BEP and BEPC under a single corporate share class, alongside the acquisition of Aypa Power, the leading North American battery storage platform.
Brookfield Corporation
Brookfield Corp reported a strong quarter with distributable earnings per share of $0.61, up 15%. Revenue reached $19.41B. The company raised $98 billion in capital, deployed $100 billion into opportunities, and monetized $40 billion of assets. Asset recycling and capital deployment remain the core operating rhythm. The pending merger with Brookfield Asset Management will deepen the permanent capital base. BN repurchased shares at a meaningful discount to intrinsic value. The overall Brookfield platform continues to scale with strong fundraising momentum across real estate, infrastructure, and private equity.
CCL Industries
CCL Industries reported record Q2 2026 results despite ongoing geopolitical headwinds from the Middle East conflict. Revenue reached $2,110M USD, up 9% from the prior year, with organic growth of 5.0%, acquisition-related growth of 1.8% and a 2.3% positive impact from foreign currency translation. Results were supported by the strength in the CCL and Innovia segments only partially offset by a decline at Checkpoint. Adjusted EPS came in at $1.35 per Class B share, up 11% and a new quarterly record. Management attributed the performance to disciplined execution across most segments despite inflationary cost pressures.
Fortis Inc.
Fortis reported a solid quarter with revenue up modestly and adjusted EPS up 3%. The company posted earnings per share of $0.78, compared to $0.76 in Q2 2025, supported by steady performance across its regulated utilities as they execute the 2026 capital plan. Revenue came in at $2.93B, reflecting growth from its rate base expansion. Fortis remains on track with its $28.8B five-year capital plan, targeting a mid-year rate base of $57.9B by 2030. The Tilbury Phase 1B LNG expansion in British Columbia was approved during the quarter, adding incremental capital opportunity. Management reaffirmed 4-6% Annual dividend growth guidance through 2030.
Granite REIT
Granite REIT reported a strong quarter with revenue up 10.6% to $165.1M and FFO per unit up 12.2% to $1.56. Same-property NOI grew 8.3% on a constant-currency cash basis, with in-place occupancy of 98.0% across 139 properties in seven countries. Logistics and industrial demand across North America and Europe remained firm with committed occupancy at 98.1%. AFFO per unit rose 2.4% to $1.26. The trust reaffirmed its 2026 AFFO per unit guidance of $5.40 to $5.55 implying 4% to 7% growth over 2025. The monthly distribution of $0.2958 per unit reflects the 4.4% increase from late 2025. Granite’s low payout ratio and diversified tenant base keeps the distribution well covered.
The Home Depot
Home Depot reported a strong quarter with revenue up 5.7% and adjusted EPS up 5.1%. Results were driven by demand for smaller projects, SRS and GMS, and $685M of tariff refunds. Comparable sales rose 1.7% (U.S. up 1.3%), the best comp since fiscal Q3 2022, with average tickets up 2.8% and transactions down 0.8%. Comps improved each month, Pro outperformed DIY, SRS comped above the company average, and digital sales grew 11%. Gross margin rose to 33.7% while operating margin slipped to 14.3%. Management reaffirmed fiscal 2026 guidance (sales up 2.5% to 4.5%, adjusted EPS flat to up 4%) and said housing turnover sits at record lows with no inflection in sight.
LeMaitre Vascular
LeMaitre Vascular reported a strong quarter with revenue up 10% and adjusted EPS up 23%. Sales reached $70.4M, driven by record performance across grafts (+23%), carotid shunts (+18%), and patches (+4%). The Artegraft international rollout continues to gain traction, now approved in 56 countries and representing 21% of total sales. EBITDA margins expanded on solid operating discipline. Management raised full-year guidance. The 25% dividend hike declared earlier this year shows confidence in the business model, and the balance sheet remains strong. LMAT is executing on its acquisition-led growth strategy while delivering record results across geographies.
Microsoft
Microsoft reported a strong Q4 FY2026, with revenue of $90.0B, 18% increase year over year, beating estimates by more than on-GAAP EPSAAP EPS of $4.74 rose 23%, well ahead of the $4.24 consensus. Azure crossed $100B in annual revenue for the first time, with Azure growth accelerating to 43%. Microsoft Cloud revenue reached $59.3B, up 27%. Intelligent Cloud revenue was $39.3B (+32%) and Productivity and Business Processes was $37.8B (+14%). Commercial remaining performance obligations surged 84% to $678B. Operating income rose 18% to $40.6B and net income grew 31% to $35.8B.
National Bank
National Bank reported a strong quarter with revenue up 18% and EPS up 26%. P&C net income was up 14%, driven by very strong loan growth, improving deposit margins and strong mutual-fund growth. Personal lending overall increased about 13% YoY. Organic commercial loan growth was 10%. Wealth Management was up 21% on higher revenue and fees. Capital Markets were up 32%, bolstered by Global Markets at +57% and equity structured-product origination. U.S. and Intl were the weak segments at +3% with higher PCLs slowing down growth. Global provisions for credit losses increased from $203M to $246M (+21%).
Royal Bank
Ironically, Royal Bank reported a weak quarter compared to the other Big Six with revenue up 10% and EPS up 11%. Results were partially offset by personal banking (-1%) as higher provisions for credit losses ruined the party. Total PCLs were up 14% to $1B this quarter. On a better note, commercial banking was up 12% on strong deposits (+9%) and loans (+4%). Wealth was up 32% on record revenues and higher AUM ($1.70T, +13%). Capital markets were up 16% on strong global markets and higher equities trading. Insurance was down 20% on lower Insurance Investment.
Stella-Jones
Stella-Jones reported a mixed quarter with revenue up 1% and adjusted EPS down 17%, as utility pole strength offset softer residential lumber and lower log volumes. EBITDA margin declined to 16% from 18.3%, impacted by site-specific environmental costs, higher fuel, and temporary inefficiencies tied to a steel-structure capacity expansion. Management expects second-half margins to recover as these headwinds ease. Cash generation was strong at $192M which was used to reduce net debt by over $100M in the first half. The quarterly dividend of $0.34 was maintained and Stella-Jones has grown its payout for 21 consecutive years.
Toromont Industries
Toromont Industries reported a strong quarter, with revenue of C$1.60B up 16% year over year. They reported basic EPS came in at C$1.53, flat versus Q2 2025, due to C$54.3M in purchase commitment expenses tied to increasing its AVL Manufacturing ownership from 60% to 80%. Adjusted EPS excluding those costs was C$2.20, up 42%. Operating income rose 41% to C$242.5M. The backlog reached a record C$2.9B, up from C$1.4B a year ago, driven by power systems and mining orders. AVL contributed C$170.6M in Q2 revenue.
Visa
Visa reported a strong fiscal Q3 2026, with net revenue of $11.6B which was up 14% year over year. Adjusted EPS of $3.32 rose 11%. Payments volume crossed $4 trillion for the first time and was up 10% on a constant-dollar basis. Total processed transactions reached 71.7B which was up 10%. Cross-border volume (ex-Europe) grew 12% in constant dollars. Data processing revenue rose 17% to $6.0B. Visa returned $6.2B to shareholders through buybacks and dividends, repurchasing 14.5M shares at a $330.71 per share average price.
Waste Connections
Waste Connections reported a strong quarter with revenue up 6.4% to $2.56B and adjusted EPS of $1.50, both beating analyst estimates. Solid waste organic growth was 6.7%, driven by core pricing of 5.6% plus fuel surcharges. Adjusted EBITDA margin expanded 70 bps to 32.8% despite fuel cost headwinds and lower commodity values. Management raised full-year guidance to revenue of $10.02-10.05B and adjusted EBITDA of $3.33-3.34B. Acquisitions with over $100M in annualized revenue were completed in the half.
My Entire Portfolio Updated for Q2 2026
Each quarter we run an exclusive report for Dividend Stocks Rock (DSR) members who subscribe to our very special additional service called DSR PRO. The PRO report includes a summary of each company’s earnings report for the period. We have been doing this for an entire year now and I wanted to share my own DSR PRO report for this portfolio. You can download the full PDF showing all the information about all my holdings. Results have been updated as of July 2nd, 2026. The next quarterly report will be available in October.
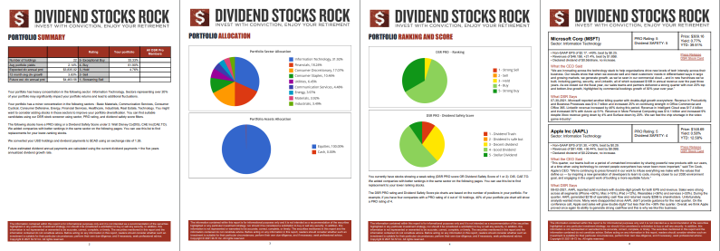
Download my portfolio Q2 2026 report.
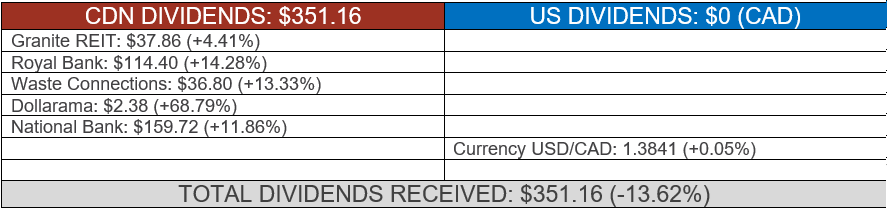
Dividend Income: $351.16 (-13.62% VS. August 2025)
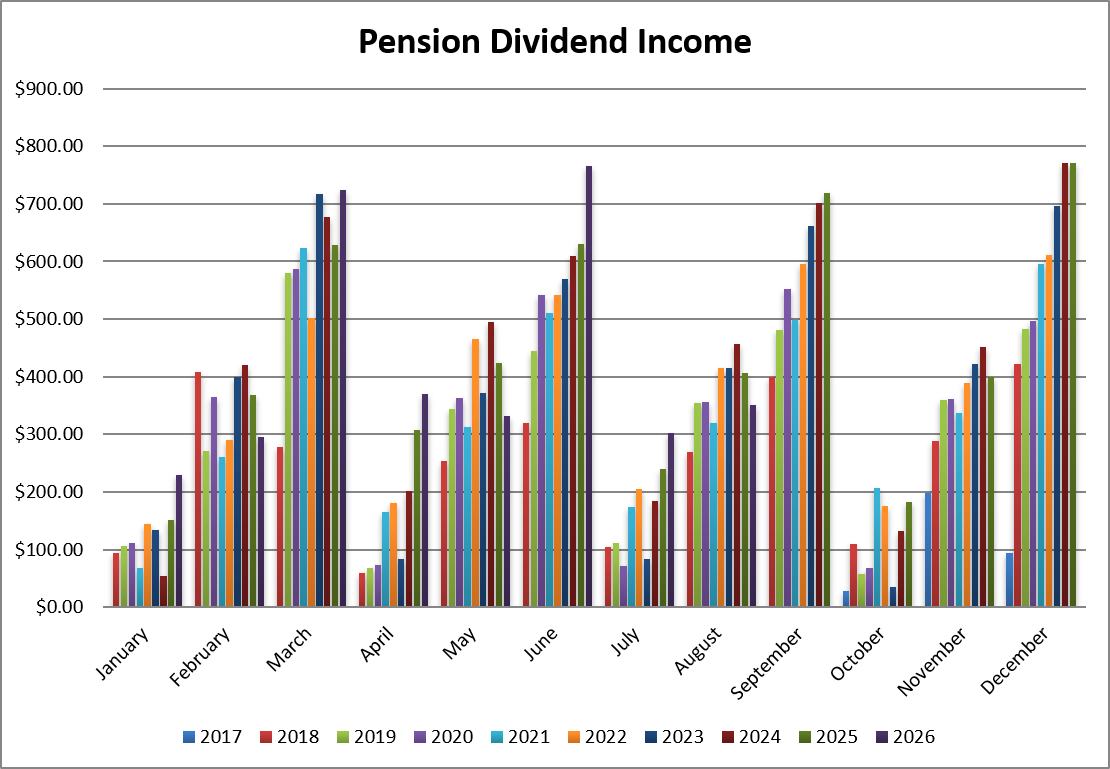
The dividend is smaller this month because, last year, I sold my positions in Apple and Starbucks. All holdings increased their payments on the Canadian side.
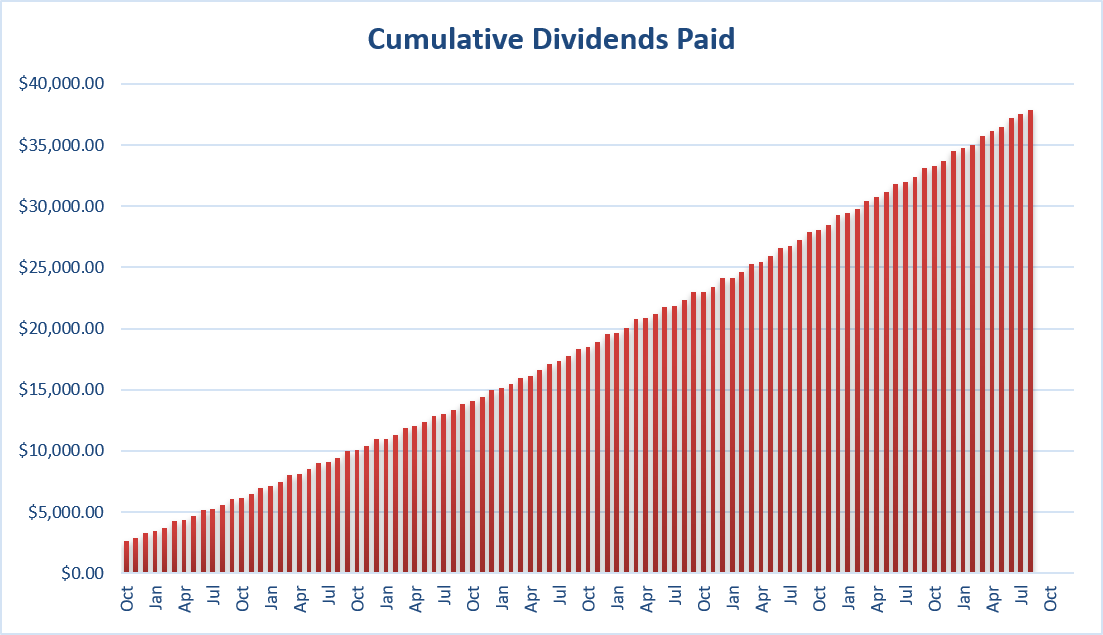
Since I started this portfolio in September 2017, I have received a total of $37,864.26 CAD in dividends. Keep in mind that this is a “pure dividend growth portfolio” as no capital can be added to this account other than retained and/or reinvested dividends. Therefore, all dividend growth is coming from the stocks and not from any additional capital being added to the account.
Final Thoughts
I started taking notes on what to look at for my year-end review. I’ll share my process in a workshop in December or early in January. The current economic situation calls for a good review that goes beyond current numbers.
I think it makes sense to position our portfolios to protect ourselves against a potential bear market and thrive once we get past the storm.
Cheers,
Mike.







Leave a Reply