

In 2016, I made a life-changing decision: I took a sabbatical, put my family in a small RV, and we drove all the way to Costa Rica.
Upon my return in 2017, I officially quit my job as a private banker at National Bank and started working full-time on my baby: Dividend Stocks Rock. I also decided to manage my pension account held at the National Bank. I’ve built and managed this portfolio publicly since 2017 to create and track a real-life case study.
In August 2017, I received $108,760.02 in a locked retirement account. Locked means I can’t add capital to the account, and growth is only generated through capital gains and dividends. I don’t report this portfolio’s results to brag about my returns or to suggest you follow my lead. My purpose has been solely to share with our members how I manage my portfolio with all the good and the bad that inevitably takes place each month. I hope you have learned and will continue to learn from my experiences managing this portfolio.
Retirement Webinar Coming Up!
At the end of 2024, I launched Retirement Loop, a membership site for Canadians building or stress-testing their retirement plan. The community grew to 500+ members fast. I had to close the doors to focus on helping those members.
I will reopen the doors for 10 days in May, starting with a free webinar on May 21st.
The topic: the 5 retirement plan vulnerabilities that quietly derail retirement plans that look perfectly solid on paper.
Click here to register for the free webinar on May 21st.
But first, the results!
Performance in Review
Let’s start with the numbers as of May 5th, 2026 (before the bell):
Original amount invested in September 2017 (no additional capital added): $108,760.02.
- Current portfolio value:$331,857.62
- Dividends paid: $5,699.84 (TTM)
- Average yield: 1.72%
- 2025 performance: +7.34%
- VFV.TO= +12.18%, XIU.TO = +28.88%
- Dividend growth: +1.5%
Total return since inception (Sep 2017- November 2025): +205.13%
Annualized return (102 months): 14.02%
Vanguard S&P 500 Index ETF (VFV.TO) annualized return (since Sept 2017): 16.18% (total return 257.70%)
iShares S&P/TSX 60 ETF (XIU.TO) annualized return (since Sept 2017): 13.14% (total return 185.60%)
Brookfield does it again
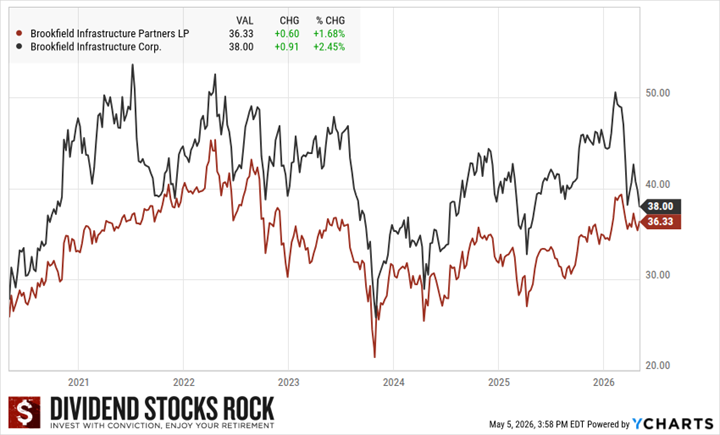
If you hold corporate shares of Brookfield Infrastructure (BIPC) or Brookfield Renewable (BEPC), you probably noticed a big drop in their stock price (about 12% in a single day!). However, if you have the unit version (BIP or BIP.UN.TO), you only noticed a small dent.
Historically, there is a premium paid for the corporate class shares. That is explained by the additional demand for holding shares rather than units from a tax perspective. Institutional investors (mutual funds, pension plans, ETFs, banks), will prefer to hold corporate class shares to avoid dealing with a different tax structure.
So, what happened? Brookfield doing a Brookfield thingy.
The ATM program: what it is and why it matters
In November 2025, Brookfield Infrastructure launched an at-the-market equity issuance program (ATM) for BIPC, with a ceiling of $400 million in BIPC shares sold from treasury at prevailing market prices. By the end of Q1 2026, BIPC had issued 3.8 million shares through this program, raising roughly $180 million.
Here is the key detail: the proceeds are used directly to repurchase BIP limited partnership units on a 1-for-1 basis. BIPC issues new corporate shares, takes the cash, and uses it to buy back BIP units. The combined count of LP units and BIPC shares outstanding is intended to remain roughly the same. The ATM program is structured to be non-dilutive in aggregate.
Why go through this exercise at all? BIPC shares and BIP units are designed to be economically equivalent. Each BIPC share can be exchanged for one BIP unit. They pay the same distribution. They represent the same underlying assets. The difference is structural.
BIP is a limited partnership, which creates tax complexity for certain investors, particularly Americans who receive K-1 forms and institutional investors barred from holding partnership units.
BIPC is a Canadian corporation that trades like a regular stock, pays dividends instead of distributions, and generates T5 or 1099-DIV forms. By shifting the capital mix from BIP units toward BIPC shares, Brookfield expands its eligible investor pool and increases the float of the more broadly investable security.
The bigger picture: a possible full consolidation
The ATM program is the opening move in what may become a more significant structural change. During the Q1 2026 earnings call, Brookfield management disclosed they have begun exploring whether BIP and BIPC should merge into a single combined corporate structure. The stated goals are to improve liquidity, increase index inclusion, and create value for investors on a tax-free basis. Management was clear that this is early-stage work with no timeline attached.
This is worth watching. BIP has been a limited partnership since its inception. A conversion to a pure corporate structure would be one of the more significant structural changes in the company’s history. It would likely increase BIPC’s eligibility for broad equity index inclusion, which would bring in a wave of passive fund buying. Index inclusion is not a trivial event for an infrastructure stock of this size. It would also simplify the tax reporting experience for a large segment of the current unitholder base.
The risk is execution. Any reorganization of this scale requires shareholder votes, regulatory approvals, and careful structuring to maintain the promised tax-deferred treatment. The 2024 reorganization of BIPC to address Canadian tax law changes gives some confidence that management knows how to run this process. But the complexity is real, and investors should not treat the announcement as a certainty.
What this means for you as a DSR member
The Q1 2026 earnings selloff was not a signal that Brookfield Infrastructure’s business is deteriorating. FFO grew 10%. Data segment FFO grew 46%. The company recycled $1 billion in capital in the first quarter alone and is on track toward its 2026 recycling targets. The dividend is growing.
The selloff was driven by three overlapping factors. First, IFRS accounting made the headline net income look terrible while the cash performance was strong. Second, Morgan Stanley’s downgrade gave institutional investors a reason to reduce exposure. Third, the ATM share issuance program, even if non-dilutive in aggregate, creates a visible supply of new BIPC shares in the market that can weigh on price in the short term.
None of these factors change the fundamental investment case. BIPC owns regulated and contracted infrastructure assets across utilities, transport, midstream, and data. Those assets generate predictable cash flows, and those cash flows support a growing dividend. The 7% dividend increase announced not too long ago alongside Q1 2026 results is consistent with the company’s long-term guidance of 5-9% annual distribution growth.
The share structure evolution toward a single corporate entity, if it proceeds, would likely be a long-term positive for BIPC and BEPC shareholders. More index inclusion means more demand. A simpler structure means fewer barriers for institutional capital. These are not reasons to buy the stock today, but they are reasons not to confuse an accounting-driven selloff with a business-driven one.
The underlying Dividend Triangle remains intact. Revenue is growing. FFO per unit is growing. The dividend is growing. If you hold BIPC or BEPC for its income and long-term compounding, nothing about Q1 2026 changes the story.
Stocks are down double-digit after earnings – What the…
As you know, we are in the middle of the earnings season. Dozens of companies are reporting each day. It brings its fair share of fluctuations.
Recently, I received a lot of emails about the Brookfields, as well as about CGI and Capital Power. Those stocks were down between 7.5% and 12% on earnings day.
I get it, it hurts when a stock is down by that much. We want to know if it will get worse or if there is something that we have missed.
But most of the time, it’s just noise.
It’s important to do due diligence, and you are right to email me with questions. I do my best to answer all of them through webinars, podcasts, or I even started recording special videos and send them to PRO members who hold the specific company in their portfolio.
It’s also important to look at the big picture. For example, I do hold CGI, but it’s about 1% of my portfolio. Will it destroy my retirement plan if the stock is down 50%? Not really.
That’s the reason why I don’t look at daily, weekly even monthly stock price movements. Someone told me, “Ah! BICP is back up 3% today, I missed the buy”.
Would 3% make a difference over 25 years? Not really. In fact, even a 10% over 25 years isn’t that significant.
We all love a good deal, but you won’t find them by tracking daily price movements.
Unfortunately, I’ve noticed the market has become quicker to jump to conclusions. Around the same time that some stocks were down double-digit, I saw Visa, Automatic Data Processing and Waste Connection jumping by 8% each.
It seems larger volume of trades are programmed to be executed on earnings reports. It’s either “really good or really bad”. But if you wait a little bit longer, you will notice that great companies always come back.
I will end by telling you I have received zero emails about V, ADP and WCN…
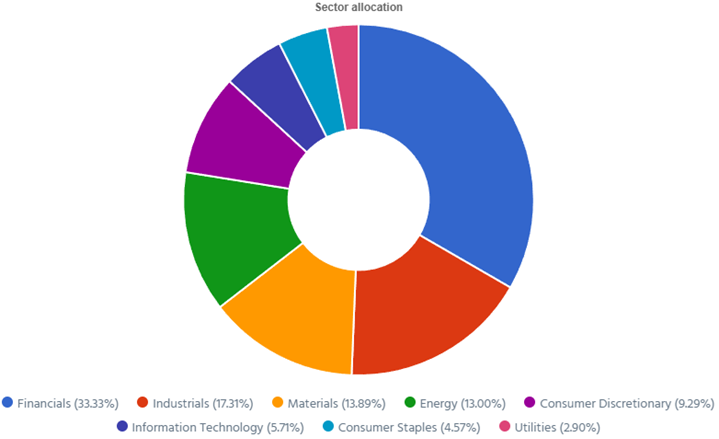
Smith Manoeuvre Update
The portfolio shows 13 companies spread across 8 sectors. My goal is to build a portfolio of thriving companies with a solid dividend triangle (e.g. with positive revenue, EPS and dividend growth trends). The current portfolio yield is at 2.09% with a 5-year CAGR dividend growth rate of 11.93%.
- The portfolio value is now at $34,919.00
- The portfolio debt is at $27,000.
- Interest paid since April 2022: $2,329.91
- Monthly contribution is set at $1,000/month.
- The annual income is $730.26, and the projected income is $814.25
- To report my Smith Manoeuvre, I export the Excel data from my DSR PRO dashboard.
The portfolio is on its way towards generating an extra $1,000 per year in dividends. I’m not there yet, but it will happen in the first months of 2027! By then, my portfolio will be close to $50,000! That will be exciting to see a 13th influx of $1,000 to boost the portfolio!
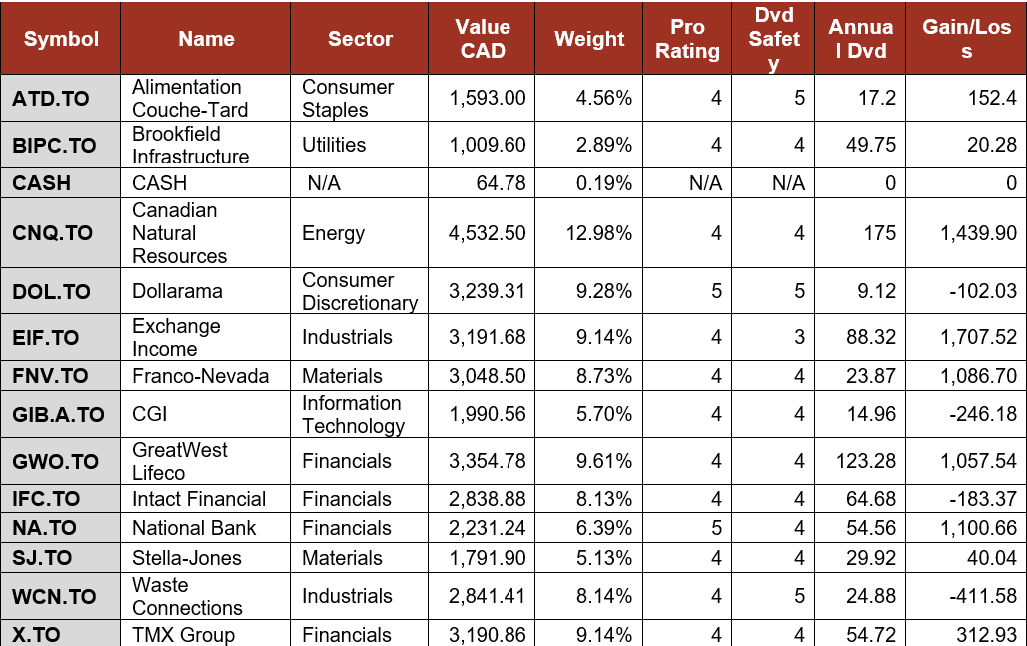
Smith Manoeuvre Portfolio Summary
Here’s my SM portfolio summary as of May 5th, 2026 (before the bell):
$1,000 invested in CGI
CGI reported a good quarter with revenue up 3.3% to $4.16B and diluted EPS up 10.6% to $2.09. Revenue growth was driven by acquisitions: BJSS boosted U.K. and Australia revenue by 16.5%, and Apside pushed Western and Southern Europe up 8.3%. The U.S. Federal segment remained pressured by decision-making delays but posted a 122% book-to-bill ratio which signaled a return to positive organic growth in Q3. Bookings were $4.31B (103.8% book-to-bill) and backlog reached $31.5B, or 1.9x annual revenue. CGI’s AI-first strategy is attracting demand across multiple industries and geographies.
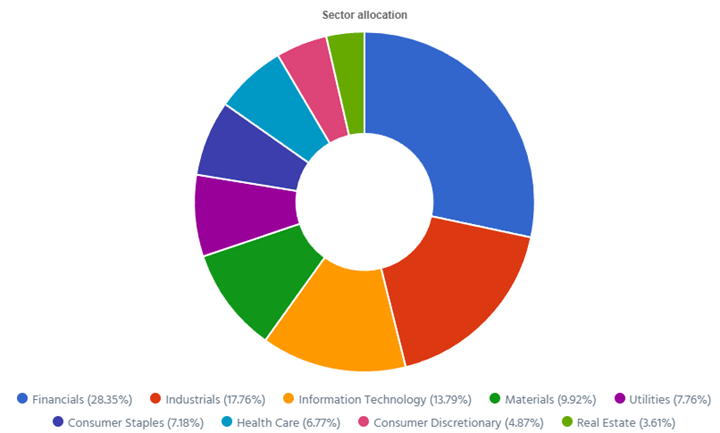
Pension Portfolio Summary
Here’s my pension plan portfolio summary as of May 5th, 2026 (before the bell):
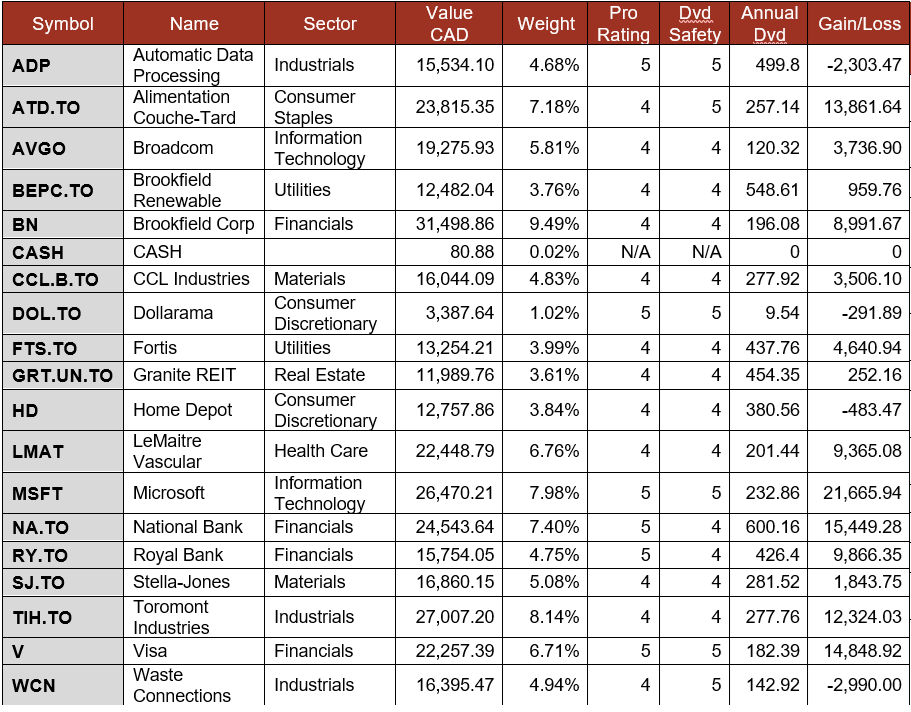
Total value: $331,857.62 (+$10,450.74, +3.25% from last month).
Automatic Data Processing shows no sign of AI panic
ADP reported a strong quarter with revenue up 7% and adjusted EPS up 12%. Employer Services grew 7% to $3.3B on strong client retention and new business bookings. PEO & HCM Services grew 7% to $1.6B. Interest on funds held for clients added $171M (+13%). Adjusted EBIT margin expanded 80bps to 28.3%. EPS benefited from a lower tax rate. ADP raised full-year revenue guidance to 6-7% growth and adjusted EPS guidance to 10-12%. ADP Assist, its AI assistant, is now embedded across HCM workflows with millions of active users.
Brookfield Renewable generates FFO growth
Brookfield Renewable reported a strong quarter with revenue up 27% and FFO per unit up 10%. Hydroelectric generation reached 8,024 GWh, Wind generated 4,165 GWh, Solar contributed 3,946 GWh, and Distributed Energy & Sustainable Solutions added 1,527 GWh. Total generation hit 17,662 GWh for the quarter. The strong FFO growth was driven by higher generation volumes, inflation-linked contracted revenue increases, and margin enhancements from asset optimization. BEPC added 7 GW of new capacity in 2025. Quarterly dividend held at $0.355/unit after a 5% increase in February 2026. No specific revenue or FFO guidance was provided for 2026.
Fortis as boring as it gets
Fortis delivered a solid Q1 2026, with net earnings of $501M ($0.99/share basic), essentially flat versus $499M a year ago. Revenue rose to approximately $3.4B from $3.3B in Q1 2025, reflecting continued rate base expansion across its regulated utility portfolio. Capital expenditures reached $1.4B in the quarter, tracking toward the full-year $5.6B plan and the $28.8B five-year capital program. The 2026–2030 plan targets a 7% rate base CAGR, growing mid-year rate base from $42.4B to $57.9B by 2030. Management’s 4–6% annual dividend growth guidance through 2030 remains intact, and the $0.64/share quarterly dividend continues. Q1 results met expectations.
Granite REIT improves its payout ratio
Granite REIT posted solid Q1 2026 results. FFO rose to $1.57/unit (+7.5% from $1.46 in Q1 2025) while AFFO held flat at $1.41/unit, impacted by higher maintenance capex. Revenue grew to $165.8M from $154.7M (+7.2% YoY), driven by new leasing activity, contractual rent adjustments, CPI-based increases, and eight US/UK acquisitions made in 2025. Same-property NOI on a constant currency basis grew 8.3%. In-place occupancy was 97.5%, with committed occupancy at 98.3% as of May 6. Granite maintained its 2026 guidance: FFO $6.25–$6.40/unit, AFFO $5.40–$5.55/unit. AFFO payout ratio improved to 63% from 66% in Q1 2025.
LeMaitre Vascular raises guidance
LeMaitre Vascular reported a strong quarter with revenue of $66.6 million, up 11%, and adjusted EPS of $0.68, up 42%. All three geographic regions posted record sales, with EMEA up 20%, APAC up 18%, and Americas up 7%. Grafts led product growth at 20%, followed by valvulotomes at 15% and carotid shunts at 11%. Gross margin reached 72.7%, reflecting strong pricing and product mix. The company raised its full-year 2026 guidance to 12% revenue growth and 26% EPS growth. LMAT compounds steadily through acquisitions and organic growth, supported by a sticky hospital customer base and durable pricing power.
Microsoft disappoints with earnings up 21% (really?)
Microsoft reported a strong quarter with revenue up 18% and adjusted EPS up 21%. Intelligent Cloud led with $34.7B (+30%) as Azure grew 40%. Productivity and Business Processes reached $35.0B (+17%) on Microsoft 365 momentum. More Personal Computing declined to $13.2B (-1%). Microsoft Cloud revenue hit $54.5B (+29%). AI annualized revenue surpassed $37B, up 123%. GitHub Copilot now has 15 million paid users. Operating income grew 16% to $32.0B. Commercial remaining performance obligation surged 110% to $315B. MSFT invested $30.9B in CapEx to support AI and cloud infrastructure build-out. Q4 guidance calls for $86.7B-$87.8B in revenue.
Stella-Jones misses the mark
Stella-Jones posted a mixed Q1 2026. Revenue grew 2.3% to $791M but missed consensus of $819.78M by 3.5%. Adjusted EPS of $1.12 fell 2.6% from $1.15 a year ago and missed consensus of $1.25 by $0.13. Utility Products delivered strong results, driven by sustained demand for wood utility poles and secured contractual commitments. This sales growth was tempered by a decline in pricing, primarily due to a shift in product mix. Residential lumber and industrial products were softer. SJ’s infrastructure-linked business remains durable, though near-term results reflect a softening outside utility poles and some execution headwinds versus analyst expectations.
Toromont Industries continues to surprise
Toromont reported a strong quarter with revenue up 13% and basic EPS up 24%. Equipment Group grew 14% to $1.13B on healthy new and used equipment sales, strong rentals, and solid product support activity. CIMCO added $99M (+3%). Operating margin expanded to 11.6% from 9.1% as AVL enclosure production ramped to support data center requirements in eastern U.S. Bookings surged 44% to $793M and backlog reached $1.7B. Net earnings reached $92.7M (+25%) and operating income grew to $143M (+42%). The balance sheet remained strong with good cash generation.
Visa is… well Visa!
Visa reported a strong quarter with net revenue up 17% to $11.2B and non-GAAP EPS up 20% to $3.31, which was the highest revenue growth since 2022. Payment’s volume grew 9%, cross-border volume ex-intra-Europe rose 11%, and processed transactions increased 9% to 66.1B averaging approximately 730 million per day. Consumer spending remained resilient across geographies. Visa repurchased $7.9B in shares, its largest quarterly buyback, and authorized a new $20B program bringing total buyback capacity to approximately $33B. The quarterly dividend held at $0.670/share. Full-year FY2026 guidance was raised to low double-digit to low-teens revenue and EPS growth.
Waste Connections is no trash
Waste Connections reported a solid quarter with revenue up 6% and EPS up 9%. By line of business, solid waste collection remained the core at $1.7B (about 72% of revenue, up from $1.6B), solid waste disposal and transfer was $386.1M (+6.6%), solid waste recycling was $51.6M (-13%), E&P waste was $179.6M (+19.5%), and intermodal and other was $48.9M (+6%). Management attributed the growth mix to $55.3M of net acquisition contribution in the quarter plus 3.1% organic growth in solid waste, led by 6% core price and 4.7% yield, partly offset by unit volume down 1.5% (with weather called out as a factor) and a small headwind from recycling.
Adding 6.5 shares of Dollorama (DOL.TO)
I had about $1,000 in my cash account (thank you, dividends!), and I benefited from price weakness to buy more of DOL.TO. I considered adding more of Broadcom (AVGO) as mentioned last month. However, at the time of doing the trade, AVGO was sitting at my target of 3% weight while DOL was at 2.65%.
I would have been happy either way.
My Entire Portfolio Updated for Q1 2026
Each quarter we run an exclusive report for Dividend Stocks Rock (DSR) members who subscribe to our very special additional service called DSR PRO. The PRO report includes a summary of each company’s earnings report for the period. We have been doing this for an entire year now and I wanted to share my own DSR PRO report for this portfolio. You can download the full PDF showing all the information about all my holdings. Results have been updated as of April 7th, 2026. Next quarterly report will be available in July.
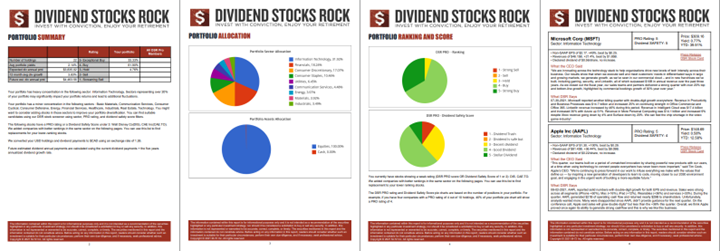
Download my portfolio Q1 2026 report.
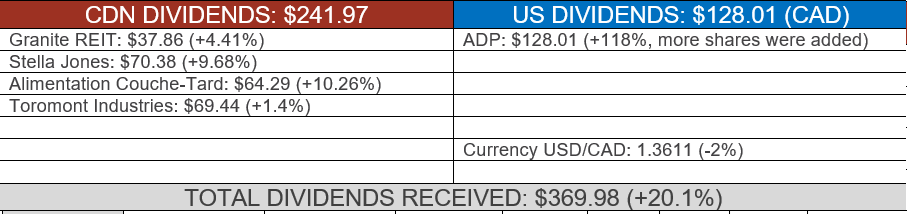
Dividend Income: $369.98 (+20.1% VS. April 2025)
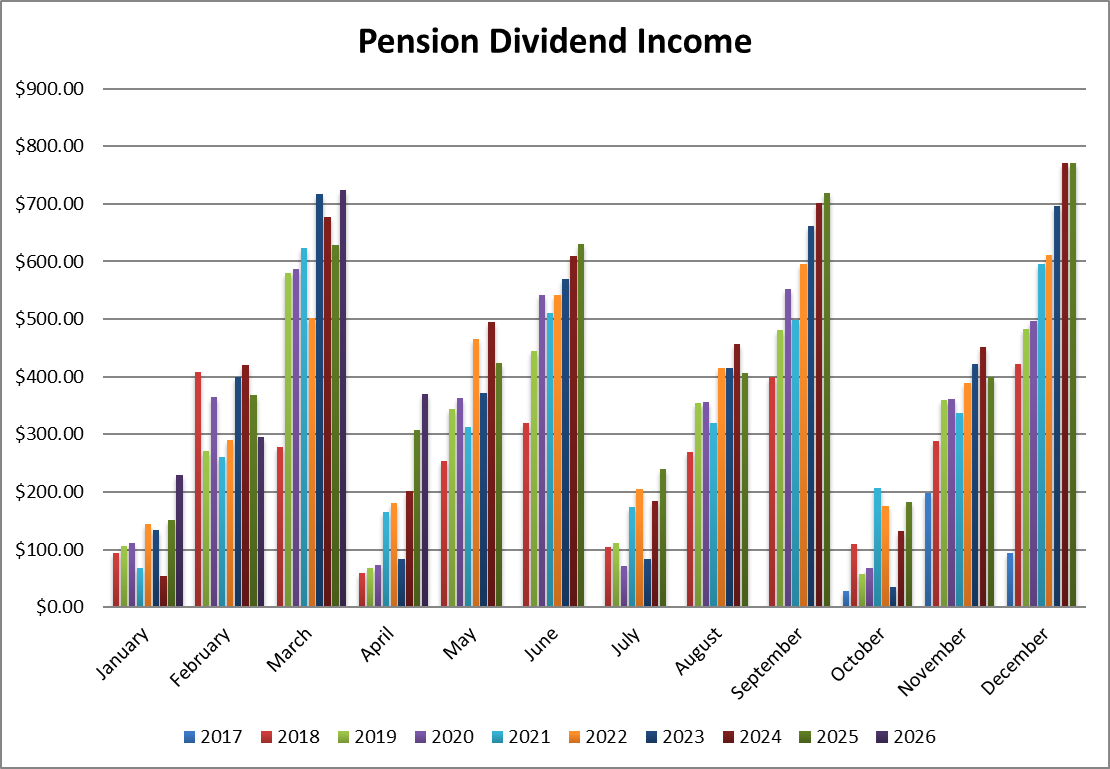
Another month with more dividends than last year! I added shares of ADP + all companies paid more in dividends vs. last year. That’s the power of dividend growth investing!
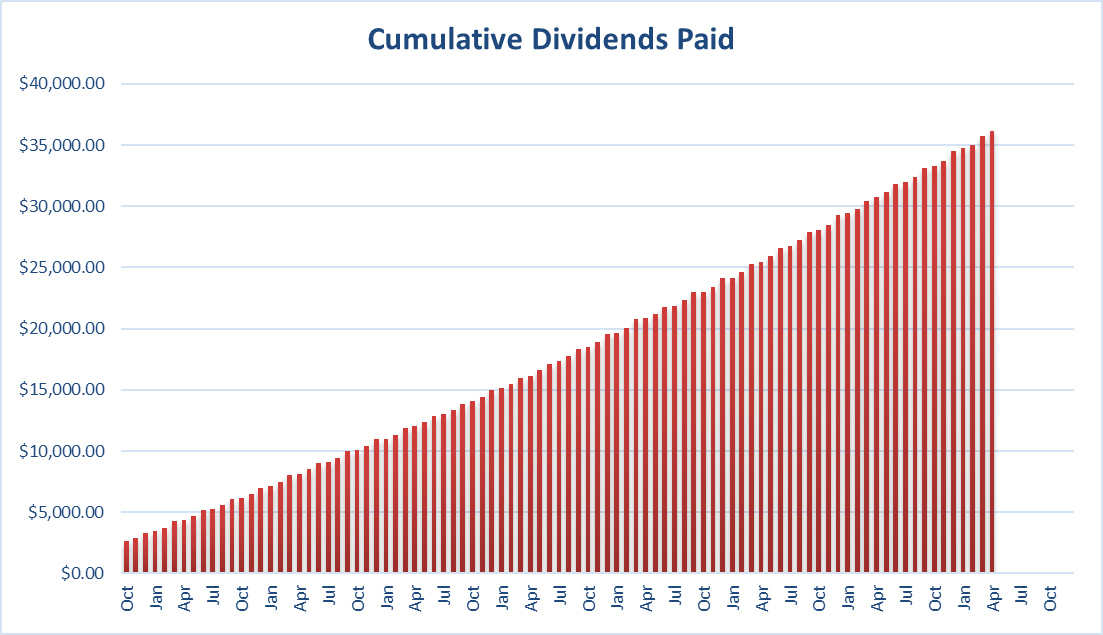
Since I started this portfolio in September 2017, I have received a total of $36,112.67 CAD in dividends. Keep in mind that this is a “pure dividend growth portfolio” as no capital can be added to this account other than retained and/or reinvested dividends. Therefore, all dividend growth is coming from the stocks and not from any additional capital being added to the account.
Final Thoughts
We are now entering the famous “Sell in May and go away” period. The only thing I can say about this saying is that we have been expecting the market to burst in our face for the past 3 years. I’m the first one surprised to see green across the board so far this year again.
As long as your companies report growth, your portfolio will be fine. No matter what the media tells you.
Cheers,
Mike.


Leave a Reply