

In 2016, I made a life-changing decision: I took a sabbatical, put my family in a small RV, and we drove all the way to Costa Rica.
Upon my return in 2017, I officially quit my job as a private banker at National Bank and started working full-time on my baby: Dividend Stocks Rock. I also decided to manage my pension account held at the National Bank. I’ve built and managed this portfolio publicly since 2017 to create and track a real-life case study.
In August 2017, I received $108,760.02 in a locked retirement account. Locked means I can’t add capital to the account, and growth is only generated through capital gains and dividends. I don’t report this portfolio’s results to brag about my returns or to suggest you follow my lead. My purpose has been solely to share with our members how I manage my portfolio with all the good and the bad that inevitably takes place each month. I hope you have learned and will continue to learn from my experiences managing this portfolio.
The Two Forces Reshaping your Portfolio Right Now
I’m gone for a week on a quick break, and now it costs me $30 more to fuel my Jeep. What went wrong?
There is a lot of noise these days. More than usual. I know because I receive more emails than usual (keep them coming!).
Two major forces are hitting the market simultaneously, and I want to cut through the chaos and give you a clear framework for what this means for your portfolio.
Here is what we are dealing with:
- AI is disrupting entire sectors, and the market is repricing stocks fast.
- The war in Iran has sent oil prices surging past $110 a barrel (for a split second), and inflation is back on the table.
Neither of these is a reason to panic. Both require a clear head and a process.
Let’s go over these events one at a time.
But first, the results!
Performance in Review
Let’s start with the numbers as of March 9rd, 2026 (before the bell):
Original amount invested in September 2017 (no additional capital added): $108,760.02.
- Current portfolio value: $325,975.06
- Dividends paid: $5,234.16 (TTM)
- Average yield: 1.61%
- 2025 performance: +7.34%
- VFV.TO= +12.18%, XIU.TO = +28.88%
- Dividend growth: +1.5%
Total return since inception (Sep 2017- February 2026): +199.72%
Annualized return (100 months): 14.08%
Vanguard S&P 500 Index ETF (VFV.TO) annualized return (since Sept 2017): 15.57% (total return 234.0%)
iShares S&P/TSX 60 ETF (XIU.TO) annualized return (since Sept 2017): 13.01% (total return 177.20%)
Part 1: AI and Your Dividend Portfolio
What is Actually Happening
Think of AI like the invention of electricity. In 1900, people were not panicking about electricity destroying their investments. They were asking: which companies will benefit, and which ones will get left behind?
That is the right question to ask now.
The market has been going through a visible rotation. Dividend payers have been outperforming so far this year as investors rotate from large-cap AI names into “old economy” stocks. The iShares Select Dividend ETF (DVY) is up nearly 8% year to date while the S&P 500 is down 1%. It could get worse between the time I write this newsletter (Monday morning) and the time you read it (this very Friday).
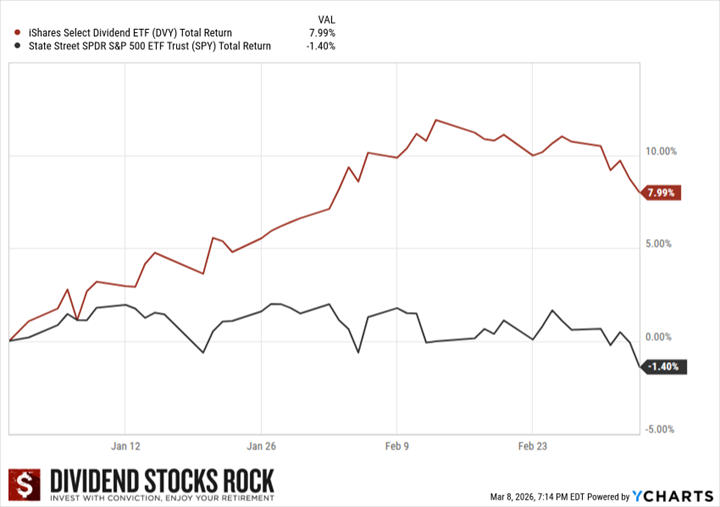
That is not a small gap. That is a meaningful shift.
But here is where it gets more nuanced. AI is not a threat to all stocks. It is a threat to specific ones, and an opportunity for others. Know what you own and why you own it.
However, you already know that if you focus on quality dividend growers, chances are good for success.
The Stocks That Should Worry You
Some sectors are being hit over fears of disruption by AI. Software stocks (Software as a Service or SaaS) tanked earlier this year after Anthropic’s latest AI model (Claude and its “spin-offs” Claude Cowork and Claude Code) appeared to allow businesses to do legal work and build programs for which they would otherwise pay an expensive license. The iShares Expanded Tech-Software Sector ETF (IGV) has dropped nearly 17% so far this year.
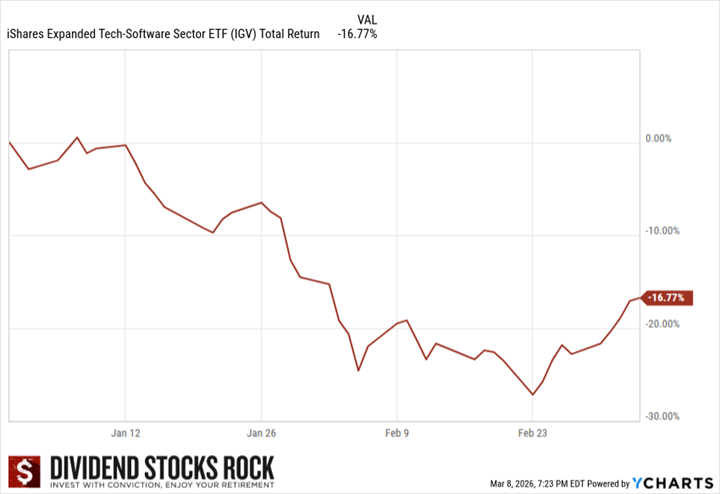
That is not noise. That is the market telling you something real.
If you own software names that depend on pricing power through expensive licensing, you need to revisit your thesis. Not because I am telling you to sell, but because the investment thesis may have changed. When the thesis breaks, you update your position. That is the rule.
But what do YOU do, Mike?
I hear that one often. I get it, you want to know what I’ve been doing with my investments since I’m a big fan of the tech sector. I’ll tell you in a second, but first remember you can take my ideas, but you can’t take my conviction. Therefore, what I do with my portfolio is not likely the best move for you.
If you have paid attention to my newsletter since the beginning of the year, you noticed I bought more of CGI (GIB.A.TO) and I even added one share of Constellation Software (CSU.TO).
Speaking of which, here are a few highlights from CSU’s latest earnings:
Constellation Software reported a mixed quarter with revenue up 18%, but EPS dropped by 61%. Growth was supported by a mix of acquisitions (10%), organic growth (6%) and currency fluctuation (2%). The EPS was affected by a liability revaluation linked to Topicus’ investment in Asseco in the amount of $155M.
Cash flow from operations (CFO) was up 16%, and free cash flow (FCF) was down 12%. For the full year, CFO was up 24% and FCF was up 14%. CSU invested $2.1B in new acquisitions for the full year and has signed $802 M in commitments to acquire more businesses after December 31st. The company doesn’t show signs of a slowdown.
Allow me to open a parenthesis about hockey for a second (it will make sense, I promise). If you follow the NHL as I do, the trade deadline was Friday, March 6th. With all the chaos during that week and some teams going all-in like the Avalanche (my son and I believe Mackinnon is the world’s best player, sorry Connor), what did Kent Hughes, the Montreal Canadiens’ GM, do?
Nothing.
You know why? Because no trade is a good trade.
Many times, staying true to your process and remaining calm is the best course of action. That applies to hockey and, of course, to your portfolio!
Nonetheless, some SaaS are at risk. Those who simply charge per license without offering much else are running very fast towards a brick wall. The biggest problem here is that it’s hard to determine which companies will adapt and which ones will fail.
Here is a podcast about 4 low-yield high-return Canadian dividend stocks:
The Stocks That Are Built to Survive
Here is the other side of the coin, and this is where the dividend framework proves its value.
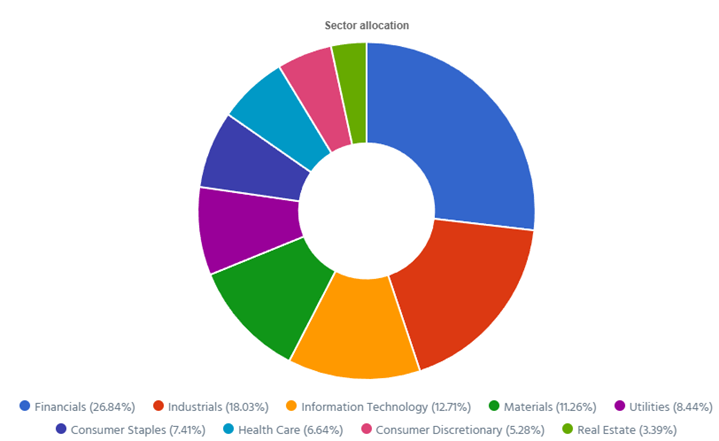
Even in a world where AI displaces jobs and disrupts businesses, people still buy groceries, use banks, pay for utilities, and fill up their cars.
Consumer staples, financials, pipelines, and infrastructure businesses are not going to wake up one morning and find that an AI took their customers. Their moats are built on physical assets, regulations, and recurring contracts. Not software licenses.
You don’t have to guess which sector will win next week. Diversification wins every day of the week.
There is also a longer-term tailwind that gets missed in all the noise. As AI starts to benefit companies more broadly from a cost savings and productivity perspective, investors are excited to take advantage of that by investing in companies that have strong track records of allowing shareholders to participate in those benefits via growing dividends.
In plain English: well-run companies will use AI to get leaner and more profitable. A portion of those savings flows to dividends. The Dividend Triangle still wins.
What to Do with This Information
First, review your thesis on any software or tech-adjacent holding. Ask yourself: is the moat still intact, or is AI a real structural threat to how this company makes money? Numbers, not stories.
I’m going to use CSU’s example once again. The story is incredibly negative. Revenue, cash flow from operations and free cash flow are up double digits for 2025. Who do you decide to trust? The narrative or the facts (numbers)? Sure, there is a threat, but most numbers remain strong.
Second, do not chase the “AI stocks” narrative. Alphabet, Microsoft, Broadcom, NVIDA, etc. are fine businesses, but do not buy them because they slapped “AI” on their investor presentations. Buy them if the Dividend Triangle is solid, and you understand their business model.
Third, keep your eyes on the sectors benefiting from AI infrastructure: utilities providing power to data centers, industrial REITs housing servers, and engineering firms, construction & equipment companies building the backbone. These are indirect plays that often carry better yield and more durable fundamentals than the flashy names.
The framework does not change. The sectors you are screening just need a second look.
Part 2: The Iran War and Your Energy Holdings
What is Actually Happening
This one is fast-moving, so here are the hard facts as of today.
The conflict began on February 28, 2026, with joint U.S.-Israeli airstrikes. Iran retaliated with missile and drone strikes on U.S. and Israeli targets, as well as Gulf states hosting U.S. forces, leading to airspace closures and attacks on energy infrastructure.
The Strait of Hormuz is the chokepoint everyone is watching. About 20% of the world’s oil and liquefied natural gas flows through the strait every day, making it one of the most crucial oil supply routes on the planet. Tanker traffic through the strait has essentially stalled as of Monday 9th.
The price impact has been dramatic. Oil prices surpassed $90 a barrel Friday March 6th, with American crude settling at $90.90 which was up 36% from a week ago, and Brent, the international standard, climbing 27% over the course of the week. Then, the barrel surged above $115 before the market opened on Monday. Crazy, I know.
The market opened the week in the red, and then, in the afternoon, Trump said the war would be over soon, which supercharged the market back into the green and sent the oil prices back into the low $80’s.
I’m not here to do politics, but if you are trying to time your portfolio with Trump actions (and social media posts), you’d better pay no fees per transaction, or you will go broke before Easter.
What This Means for Inflation and Interest Rates
Here is where this gets personal for investors.
Higher energy prices are not just a gas station problem. They feed into the cost of everything: food, shipping, manufacturing, and heating. Higher energy prices would ultimately filter through to consumer and producer prices, leaving central banks scrambling to reassess their interest rate trajectory.
The timing could not be worse. Former Treasury Secretary Janet Yellen said the conflict could hit U.S. economic growth and fuel inflationary pressures, holding the Federal Reserve back from cutting rates: “The recent Iran situation puts the Fed even more on hold, more reluctant to cut rates than they were before this happened.”
For Canadian investors, this is a direct risk to your interest-rate-sensitive holdings. Utilities, REITs, and telecoms are all vulnerable in a “higher for longer” rate environment. If you are overweight those sectors, this is your reminder to check your concentration.
Technically, if the conflict lasts, the oil price will remain high (e.g. above $75/barrel) and push inflation higher. Central Banks will be pressured to increase rates and slow down the economy. I used the word “technically” as nothing is certain here.
What This Means for Your Energy Stocks
Canadian energy companies are not the Strait of Hormuz. They are not Qatar LNG. But they benefit from the same oil price tailwind.
When Brent crude goes from $70 to $90 in a week, Canadian producers, pipelines, and royalty companies get a revenue lift. The question is whether that lift is durable or temporary. In other words, don’t get too excited.
The critical variable is the duration of the conflict. If this gets resolved in weeks, oil snaps back. If the disruption drags on, the price support holds, and energy names look even more attractive on a cash flow basis.
Here is my take. I am not going to predict the outcome of the war. Nobody can. But I will tell you how to think about it using process, not gut feel.
If you already have solid energy exposure in your portfolio, 10 to 15%, you are fine. You benefit from the tailwind without betting the whole portfolio on a geopolitical outcome.
If you are underweight energy because you were waiting for a “signal,” this is the kind of environment that reminds you why waiting for the perfect moment is a trap. You never get the signal. You just get left behind.
If you are tempted to pile into energy right now at these prices, pump the brakes. Buying a stock up 36% in a week because you think it will keep going up is not a framework. That is FOMO (Fear Of Missing Out) with a price tag.
The Interest Rate Domino
This is the knock-on effect that most investors underestimate.
If inflation re-accelerates because of sustained oil prices, the Bank of Canada and the Fed stay on hold or even reverse course on rate cuts. That means:
Utilities take another hit. REITs face continued pressure. Telecoms get re-evaluated. Anything with heavy debt refinancing needs attention.
This is why diversification is not just about sectors. It is about interest rate sensitivity. A portfolio that is 40% REITs, utilities, and telecoms right now is one inflation report away from a rough quarter.
Run your own numbers. Look at your DSR PRO dashboard: what percentage of your portfolio is rate-sensitive? If it is more than 30 percent combined, now is a good time to check the balance sheet quality and payout coverage of each name.
The Framework for Both Situations
Same process. Different inputs.
Step 1: Revisit your investment thesis. Does the thesis still hold? AI disruption changes the thesis for software names. Oil prices change the math for rate-sensitive names. Numbers first, stories second.
Step 2: Check your concentration. Are you over-indexed to any one risk? Too much tech means AI disruption hits you harder. Too much rate-sensitive means the inflation re-run hits you harder.
Step 3: Do not make panic decisions. The market is loud right now. Loud is not the same as right. Stick to the Dividend Triangle: revenue growth, earnings growth, dividend growth. If all three are intact, you hold.
Step 4: Look for opportunity. Rotations always create dislocations. Some dividend growers with solid fundamentals are getting caught in the tech selloff simply because they are in the same index. That is where patient investors find value.
How do my investments look in this environment?
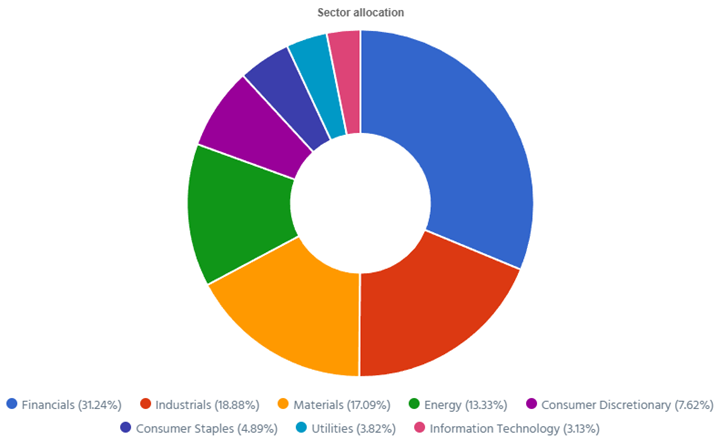
My first reflex was to do a global view of all my portfolios and look at my sectors first:
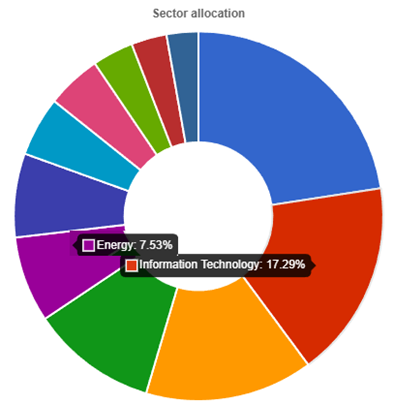
#1. I have 17% of my capital invested in tech stocks. Apple and Microsoft have different growth vectors and generate tons of cash flow. I’m zero worried about them.
Broadcom’s growth is all about AI right now. There might be a slowdown, but the company has several growth vectors and will not be disrupted by AI (likely the opposite).
Constellation Software and CGI are the two positions at risk. That’s about 3.30% of my portfolio. I believe they can use AI as a tailwind, but even if I’m wrong, it won’t destroy my portfolio.
#2. I have 7.5% exposure to the energy sector (Canadian Natural Resources and TerraVest Industries). The first one will ramp up production if the oil price remains high and cash in some profit. TVK’s business is not affected by commodity price fluctuations.
That’s a good start, but I suggest you do a deeper analysis of your portfolio. Looking at sector allocations and to your major players in each sector will cover a lot of ground. But while I was reviewing my portfolio, I thought there was a bug with my DSR PRO dashboard for a second. Where was Alphabet?
Ah yes, while my investment thesis to add Alphabet to my portfolio was based on AI, it’s classified under the communication sector!
In fact, many other companies could be affected (or disrupted) by AI. Therefore, I went through each of my positions and searched for the most exposed companies to see AI as a headwind instead of a tailwind. However, each threat is also opening to an opportunity. That’s why I won’t make any changes to my portfolio now!
Automatic Data Processing (ADP)
ADP historically wins by offering outsourced payroll, HR processing, and compliance. The problem is that AI agents can increasingly automate payroll, onboarding, compliance filings, and employee support. On the other hand, ADP could become more efficient and develop better tools to help its clients.
CGI Inc (GIB.A.TO)
CGI makes money by billing its clients the hours they use to help them. AI coding tools and automation can dramatically reduce the number of billable developer hours required for projects. On the other hand, CGI could also become more efficient, serve more clients, and scale thanks to AI.
Stantec (STN.TO)
Like CGI, if AI enables engineers to do in 5 hours what used to take 20, consulting firms face a familiar problem: efficiency lowers billable revenue unless pricing models change. Again, if Stantec combines its expertise (engineering firms are all about their talent) with AI, it could scale a lot faster.
TMX Group (X.TO)
TMX makes great recurring revenue by selling its proprietary data. Over time, AI may reduce the premium value of proprietary market data and analytics services, which are an important revenue stream for exchanges. However, TMX can also offer an enhanced version of its data services to its clients with AI helping investors analyze a larger load of information.
Constellation Software (CSU.TO)
CSU makes money by acquiring small niche vertical SaaS companies (software that is specialized to service a specific market). As mentioned previously, AI could disrupt many Saas if they don’t adapt. However, this could also mean a larger load of cheap deals to be acquired by CSU. It can use its expertise to enhance those services with AI after buying them at a lower price.
Smith Manoeuvre Update
Slowly but surely, the portfolio is taking shape with 13 companies spread across 8 sectors. My goal is to build a portfolio of thriving companies with a solid dividend triangle (e.g. with positive revenue, EPS and dividend growth trends). The current portfolio yield is at 2.16% with a 5-year CAGR dividend growth rate of 11.57%.
- The portfolio value is now at $33,109.28
- The portfolio debt is at $25,000.
- Monthly contribution is set at $1,000/month.
- The annual income is $668.89, and the projected income is $744.21
- To report my Smith Manoeuvre, I export the Excel data from my DSR PRO dashboard.
Smith Manoeuvre Portfolio Summary
Here’s my SM portfolio summary as of March 9th, 2026 (before the bell):
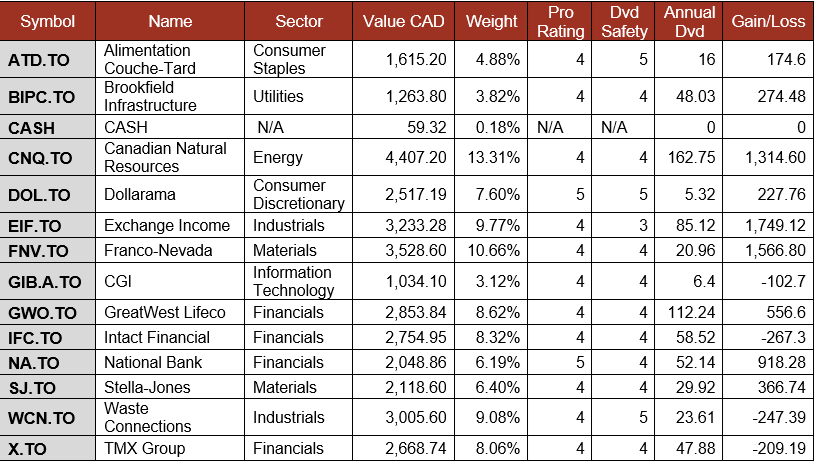
$1,000 invested in TMX
I’ve been using my monthly capital to boost a few new positions in my portfolio. I have a small set of great companies with strong dividend triangles that are trading on price weaknesses these days: TMX Group (X.TO), Stantec (STN.TO), Intact Financial (IFC.TO), CGI (GIB.A.TO). I’ll rotate my contribution amongst this group.
I’m not a big fan of “waiting for a good price”, but if I have money in my hands and I have a stock that I like and, on top of it, its price is on a downtrend, that makes me smile.
Pension Portfolio Summary
Here’s my pension plan portfolio summary as of March 9th, 2026 (before the bell):
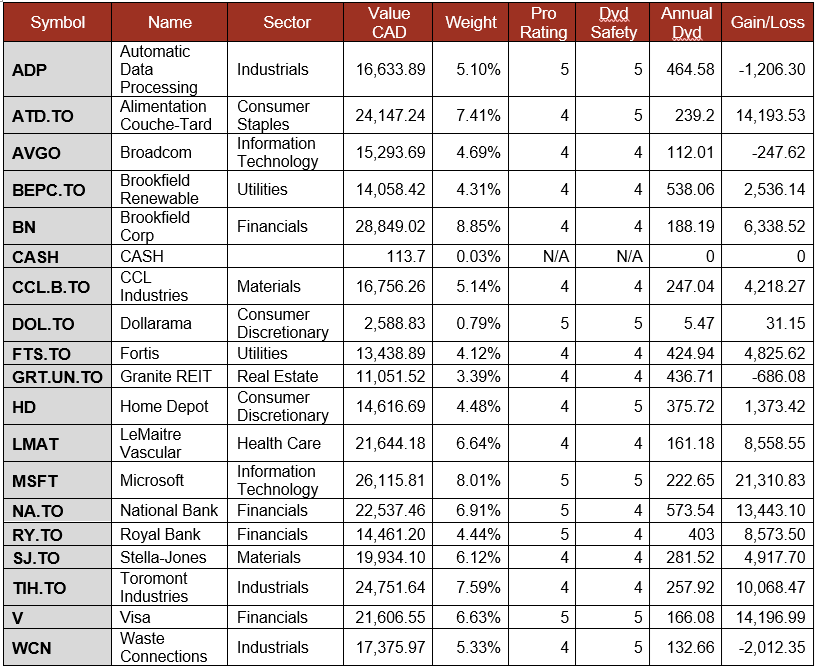
Total value: $325,975.06 (+$4,289.53, +1.33% from last month).
A few companies reported their earnings. Let’s look at them!
Broadcom is on fire!
Broadcom reported another strong quarter with revenue up 29.5% and EPS up 28%, beating analysts’ expectations. Semiconductor Solutions revenue was $12.5B (+52% YoY) while Infrastructure Software revenue was $6.8B (+1%). Management attributed the step-up in growth primarily to AI semiconductor strength, with Q1 AI revenue of $8.4B (+106%) driven by robust demand for custom AI accelerators and AI networking, while the software business was comparatively steady. AVGO reported gross margin of about 77% of revenue, operating margin of 66.4%. For Q2, management expects revenue to jump by another 47%, with AI semiconductor revenue to be $10.7B.
Please note that I used previous paid dividends from my portfolio to buy another 3 shares of AVGO in early March.
Brookfield Corp earnings are flat, but they boosted their dividend by 17%!
Brookfield disappointed the market with a flat quarter (distributable earnings per share were the same as last year). However, Asset Management delivered record distributable earnings, supported by strong fundraising across flagship and complementary strategies, increasing fee-bearing capital to $603B and driving a 22% increase in fee-related earnings to $3Bfor the year. Wealth Solutions delivered strong growth, with distributable earnings increasing 24%, supported by strong investment performance and continued expansion of the insurance asset base. Operating Businesses continued to generate growing cash flows. At least, BN boosted the dividend by 17%, congrats!
Fortis increases its CAPEX plan
Fortis reported a good quarter with EPS up 8.4%. Net Earnings were favourably adjusted by $31 million related to the disposition of Fortis’ investments in Belize in the fourth quarter of 2025, and by $63 million related to the dispositions of FortisTCI and the investments in Belize for the year ended December 31, 2025. The Corporation’s 2026-2030 capital plan of $28.8 billion is $2.8 billion higher than the previous five-year plan. The increase is primarily driven by higher transmission investments associated with new interconnections and baseline reliability projects at ITC.
Home Depot has been downgraded at DSR
Home Depot reported a weak quarter with revenue down 4% and EPS down by 10%. Keep in mind fiscal Q4 2024 had an extra week that added about $2.5B of sales. Comparable sales were up 0.4% (U.S. comps up 0.3%), reflecting relatively stable underlying demand with pressure from consumer uncertainty and housing turnover, partially offset by storm-related demand in January. Management also noted that Pro outperformed DIY and that big-ticket transactions over $1,000 were positive, but larger discretionary projects remained under pressure. HD offered a small dividend increase (+1.3%) and was downgraded from a dividend safety score of 5 to a 4.
LeMaitre Vascular raised their Dividend by 25%!
LeMaitre Vascular surprised the market with revenue being up 16%, and EPS jumped by 39% (and the stock surged on that news). The revenue increase was driven by strength in core product franchises (grafts +27%, valvulotomes +20%, and carotid shunts +18%). Ongoing international momentum in its biologic graft platform (management highlighted 29% worldwide growth for “Autograft”/Artegraft as the outside-U.S. rollout continues). EPS was bolstered by strong sales and better margins. Gross margin improved to 71.7% (+240 bps YoY), which management attributed to higher average selling prices and manufacturing efficiencies. LMAT also announced a 25% dividend increase!
National Bank keeps printing money for shareholders
National Bank reported another robust quarter with adjusted EPS up 11%. By segment: P&C net income was +52% as personal lending grew 17% and commercial lending grew 54%. Driven by the CWB acquisition. PCL was down $23M, showing better-than-expected performing loans. Wealth was up 12%, driven by growth in fee-based revenues. Capital Markets increased by 6% driven by corporate and investment banking revenues. U.S. & Intl was up 1% driven by a 7% revenue growth but partially offset by higher PCLs. NA expects to close the acquisition of the Laurentian Bank’s assets by the end of the year.
Royal Bank is the king of all banks
Royal Bank reported a solid quarter with adjusted EPS was up 13%. By segment: P&C net income increased 17%, largely driven by higher net interest income reflecting higher spreads and average volume growth of 2%, including 4% in loans. Commercial was up 11%, driven by higher net interest income, reflecting average volume growth of 5% in deposits and 4% in loans, and lower PCL. Wealth increased 32% on higher fee-based client assets reflecting market appreciation and net sales. Insurance improved by 22% and Capital Markets by 3%. The quarter reflected an increase in total PCL of $40M from a year ago, mainly reflecting higher provisions in Capital Markets and Personal Banking.
Stella-Jones’ strong utility sales growth was completely erased by other segments
Stella-Jones reported a weak quarter with revenue slightly down (-0.4%) and EPS down by 2%. Utility products (61% of Q4 sales) rose 16%, helped by the Locweld and Brooks acquisitions and, on an organic basis, a 9% increase driven entirely by higher volumes from new contracts, while overall pricing was described as relatively flat. Offsetting that, railway ties fell by 16% on fewer shipments amid competitive pressures, residential lumber was down 14% on lower volumes with relatively unchanged pricing, industrial products decreased by 19% on project timing, and logs and lumber was -54% due to less trading activity. SJ rewarded shareholders with another 10% dividend increase.
Toromont Industries announced its 37th consecutive dividend increase!
Toromont Industries reported a good quarter with revenue up 9%, but EPS was only up by 1%. By segment, Equipment Group revenue was $1.29B (+9%) and CIMCO was 133M (+10%). Management attributed the growth mainly to contributions from the acquired business (AVL) and higher Equipment Group product support, alongside strength in new equipment sales (notably power systems) and higher rental revenue on a larger fleet; at CIMCO, higher package activity and stronger product support in Canada drove the increase. EPS was affected by higher expenses as the margin fell from 16.2% to 15.3%. TIH also announced a 7.7% dividend increase, congrats!
Here is a podcast about Toromont Industries and TMX Group latest quarterly earnings:
Waste Connections’ earnings are not trash
Waste Connections reported a good quarter with revenue up 5% and EPS up 11%. By the revenue line, solid waste collection was $1.7B (+5.7%), solid waste disposal and transfer $418.3M (+2.3%), solid waste recycling $49.2M (-14.8%), E&P waste treatment/recovery/disposal $164.4M (+17.2%), and intermodal/other $41.7M (-8.4%). The quarter’s growth was primarily price-led and acquisition-supported: solid waste internal growth was +2.6% with core price up 6.4% offset by volume being down 2.7% and recycling headwinds, and acquisitions (net of divestitures) contributed about $58M of Q4 revenue. EPS grew on stronger revenue and better margins.
My Entire Portfolio Updated for Q4 2025
Each quarter we run an exclusive report for Dividend Stocks Rock (DSR) members who subscribe to our very special additional service called DSR PRO. The PRO report includes a summary of each company’s earnings report for the period. We have been doing this for an entire year now and I wanted to share my own DSR PRO report for this portfolio. You can download the full PDF showing all the information about all my holdings. Results have been updated as of January 5th, 2026. Next quarterly report will be available in April.
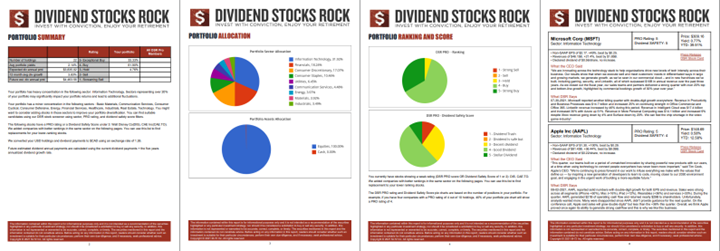
Download my portfolio Q4 2025 report.
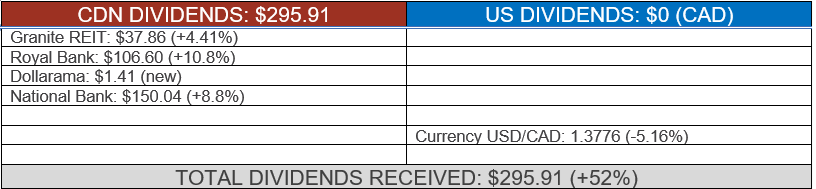
Dividend Income: $295.91 (-19% VS. FEBRUARY 2025)
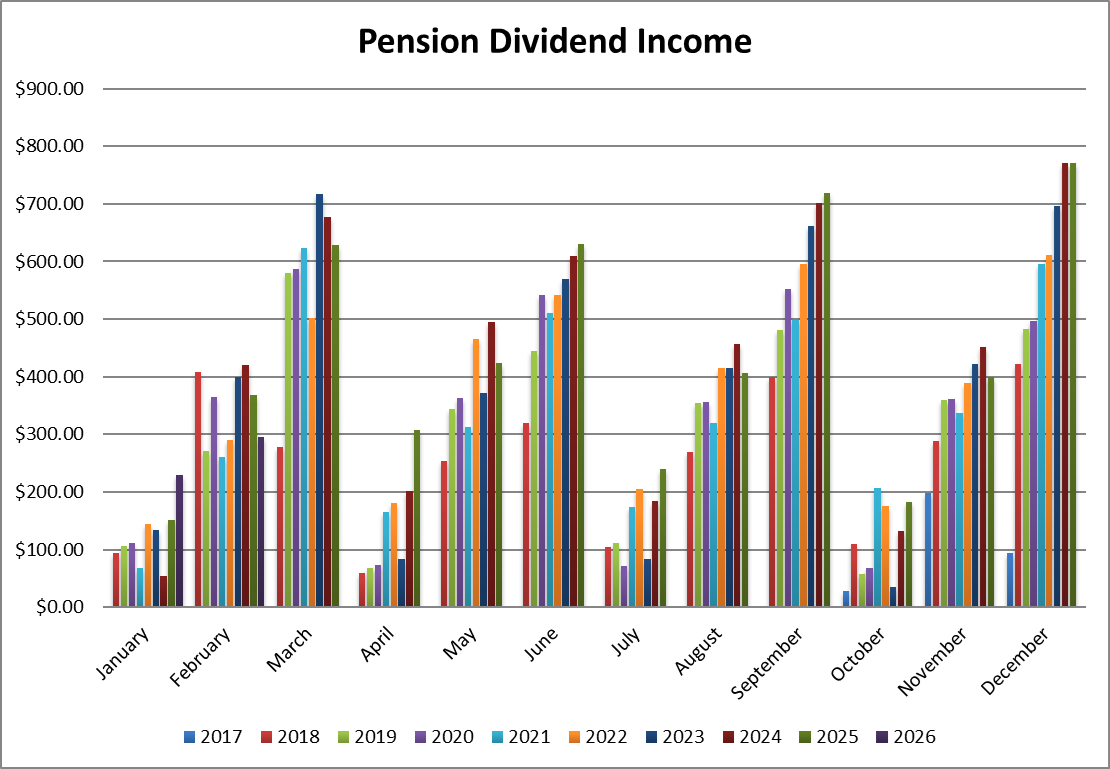
No US dividend this quarter! I sold my Apple shares last fall, and Starbucks is also no longer in my portfolio. That was $67.34 in dividends that I’m not receiving this quarter (but that money was reallocated through the portfolio).
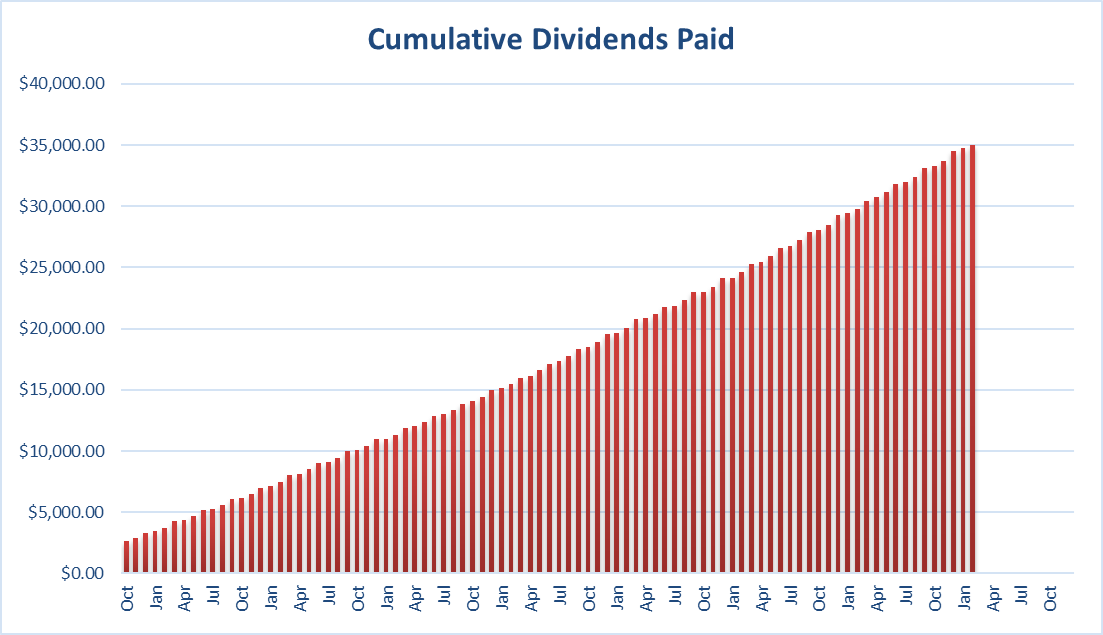
Since I started this portfolio in September 2017, I have received a total of $35,018.50 CAD in dividends. Keep in mind that this is a “pure dividend growth portfolio” as no capital can be added to this account other than retained and/or reinvested dividends. Therefore, all dividend growth is coming from the stocks and not from any additional capital being added to the account.
Final Thoughts
I have been in this business long enough to remember the 2008 oil spike, the COVID crash, and the 2022 rate shock. Every single time, investors who abandoned their process regretted it. Every single time, investors who stayed invested in quality companies came out ahead.
This time is not different. It is just louder.
The war in Iran is scary. AI is disruptive. Both things are true, and both of them are survivable with a clear process and a portfolio built on fundamentals.
Cheers,
Mike.


Hi Mike – I’ve started listening to your podcast and love your content. I’m debating subscribing to get even more content. One question (and I don’t meant this sarcastically). You show return rates for VFV and XIU that are pretty strong – I assume this is for a comparable to your portfolio. Given the strong performance of those, would it be better to invest in those ETFs vs single stocks? Appreciate your thoughts.
Hey James,
Very good question. For several years, my portoflio return was better than my benchmark. Right now, I’m behind by about 0.20% annualized return.
I prefer to have control over my holdings and know what I invest in for this very small difference 😉