
Cash flow is powerful—but as a first screen, it’s too volatile.
I start with the Dividend Triangle—multi-year trends in revenue, EPS, and dividends—to find steady compounders across cycles.
Then I bring in cash flow to confirm my thesis and verify the safety of the dividend.
If you want CFO mechanics and the BCE visuals, see Part 1: Operating Cash Flow vs Free Cash Flow: Follow the Cash (Case Study).
The Dividend Triangle Comes First

Your first pass should be fast, comparable, and calm. The Triangle—consistent growth in revenue, EPS, and dividends—does exactly that.
EPS, in particular, remains central: it reflects profitability, pricing power, and capital allocation in a way that’s widely available and comparable across most sectors. Names that pass this gate tend to be those you can own through different business climates.
You can read more about The Dividend Triangle here.
Why Cash Flow Is Lumpy (and Not a First-Pass Tool)
CFO is noisy.
Working capital timing, inventory builds, and one-offs can make great businesses look weak for a quarter or two.
Pull decade-long cash charts for Apple, Lockheed Martin, Canadian National, or Royal Bank and you’ll see it: strong long-term compounding with choppy year-to-year flows.
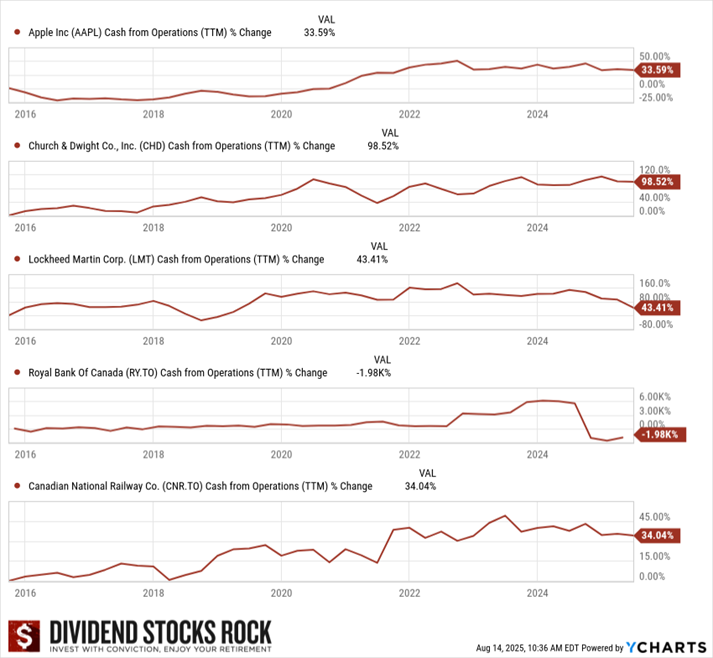
If you lead with CFO, you risk throwing out winners because of normal timing quirks. Keep it as a second-step check, where it can confirm—not prematurely exclude.
Where Cash Flow Fits: The Second-Step Check
Once a company clears the Triangle, I ask three cash questions:
- CFO vs. dividends: Does cash from operations comfortably cover what’s paid out—over multiple years, not one quarter?
- FCF and funding: Is weak FCF just a build-out effect, or is the firm borrowing to fund dividends?
- Debt trend: Is leverage stable or improving while the plan plays out?
This is where cash earns its keep. It tells you if earnings translate into real money and whether the balance sheet is being used responsibly.
Use the List that Focuses on What Matters
 Skip the buy struggle.
Use the Dividend Rock Star List to screen with the Dividend Triangle first and cut the universe down to about 300 quality names.
From there, dig into cash flow from operations, free cash flow, and debt to make a clear, confident decision.
Telus: A Same-Sector Contrast That Passes the Cash Test (with Caveats)
Since Telus and BCE share business models, Telus is a helpful contrast. Telus raised its dividend in 2025, not cut it.
At first glance, payout looks tight—but the cash payout ratio sits at a comfortable ~71%.
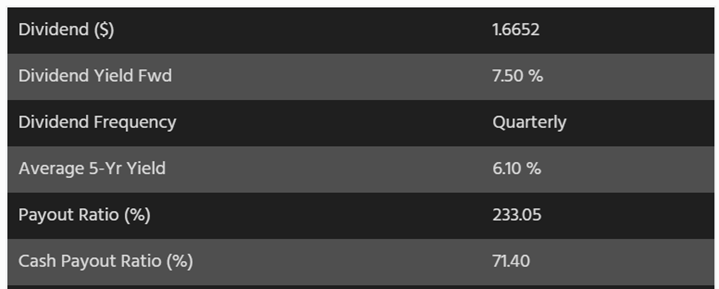
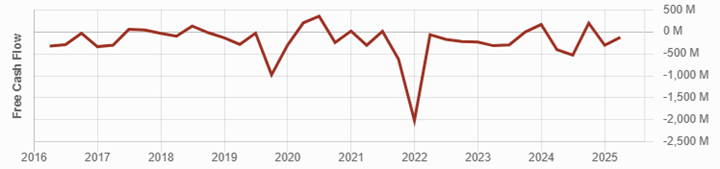
Free cash flow was under pressure for a few years, but the financial statements show improvement more recently. It’s not perfect, so it deserves quarterly monitoring.
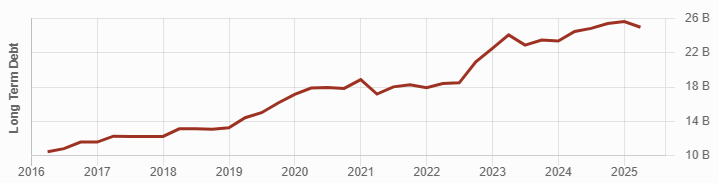
Debt? Similar altitude to BCE for a while, but it started to decrease in 2025.
Telus also announced a tower business spin-off and sold 49% for $1.26B, using proceeds to pay down a portion of debt. That matters when you’re investing through build cycles.
Final verdict
Telus’ dividend is safe but requires monitoring. Cash flow improved in the last 18 months, and management is focused on both cash generation and deleveraging. This supports Telus’ dividend growth guidance of 3%–8% through 2028.
For now, Telus maintains a high dividend safety score; if actual growth tracks the low end of guidance for a while, that could cause it to move down.
Sector Exceptions (Don’t Force CFO Where It Doesn’t Fit)
Banks: Net income matters far more than cash flow because of how loans and deposits flow through accounting. Use CET1 (Common Equity Tier 1 Capital ÷ Risk-Weighted Assets) as your balance-sheet anchor; Big 6 are usually in the low-teens.
Insurers: Focus on the combined ratio to judge underwriting discipline. Below 100% indicates underwriting profit; above 100% means claims exceed premiums.
REITs & Energy infrastructure: Use FFO/AFFO (often per share or unit) rather than classic CFO/FCF to assess payout sustainability.
Always match the metric to the business model.
CAPEX Cycles: When “Negative” Isn’t Bad
Multi-year investment cycles are normal in utilities, telecoms, pipelines—and lately in tech for AI. FCF can compress or go negative during these phases, often financed with debt.
Managed well, these cycles create future cash flow.
Your job is to track the plan, expected returns, and debt trajectory. If CFO covers the dividend and leverage edges down as projects complete, you’re being paid to wait.
Spot Red Flags Like a Hawk
- Start with the Dividend Triangle (weak revenue or EPS often foreshadows weak cash).
- Check the CFO trend (rising or stable through a cycle?).
- If CFO is weak, check cash payout and debt.
- Read the latest quarterly for CAPEX context.
- Judge management’s plan and odds of success.
- Watch the dividend growth trend.
- Revisit your thesis if the numbers and story don’t rhyme.
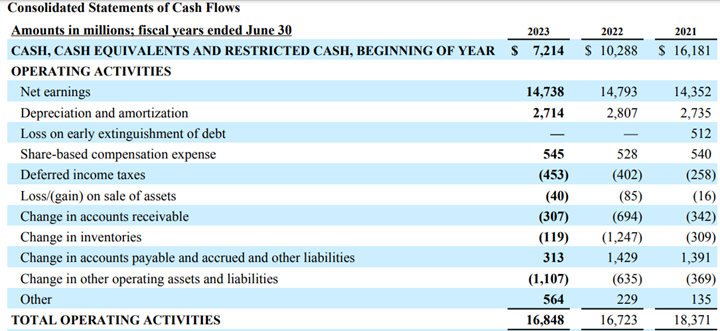
A Quick, Non-Telco Example: Procter & Gamble
In 2023, PG’s operating cash flow covered CAPEX, paid dividends, funded buybacks—and still increased cash on hand.
That’s what the second-step cash check looks like in a stable compounder: earnings translate into cash, and the capital return is funded by operations.
How to Apply What You’ve Just Read
A calm first filter should reward consistency, not timing noise.
That’s why I start with the Dividend Triangle. Then I put cash to work—CFO to confirm the dividend is earned by operations, FCF and debt to judge funding and balance-sheet risk.
Same tools, right order, fewer mistakes.
Find your next buy without second-guessing
- Start with the Dividend Triangle to get a focused shortlist.
- Work from about 300 quality names instead of thousands.
- Then, verify your thesis by reviewing CFO, FCF, and debt in the company financials.
Open the Dividend Rock Star List


Leave a Reply