
Cash is king—and operating cash flow (OCF or CFO) is the clearest look at how much cash the business actually generates from day-to-day operations. It’s the money that hits the bank after customers pay and the company covers the costs of running the business, before financing and investing decisions.
Many investors watch cash flow because it’s harder to “polish” than earnings. When margins are stable, CFO tends to follow revenue trends. That’s why management often talks about revenues and earnings on earnings day, but the cash story—the real pulse—lives in the cash flow statement.
The Three Cash Buckets
Companies report cash in three parts:
- Cash from Operations (CFO): Cash generated by normal business activities. Think: “what did the firm earn from its core operations?”
- Cash from Financing: Borrowing and paying back debt, issuing or repurchasing shares, and paying dividends.
- Cash from Investing: CAPEX, acquisitions, asset sales, and other investment flows.
This post focuses on CFO because it shows the engine at work.
Why CFO Often Tells the “Real” Story
Earnings can be distorted by non-cash items; cash is harder to spin. Heavy amortization, for example, can depress EPS but doesn’t touch cash in the bank.
Use your Fortis chart to make this tangible: over a decade, revenue and CFO can move together while EPS diverges due to accounting items and CAPEX. That’s the point—CFO lets you see through “clean” earnings to what the business truly collects and pays.
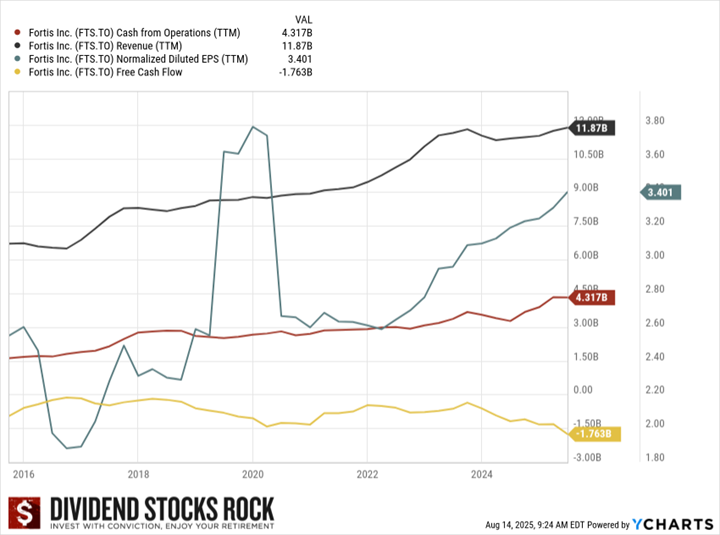
We generally prefer CFO to free cash flow (FCF) when you want a clean read on the core engine. FCF includes CAPEX, which can jump around based on project timing and financing. Looking only at FCF can be misleading if you land on a big-spend quarter. Over a cycle, a steadily rising CFO is a strong signal that the business is healthy and the dividend is likely safe.
Quick formula
CFO = Net Income + Non-Cash Items + Changes in Working Capital.
Non-cash items include depreciation, amortization, and impairments—things that move EPS but not the bank balance. Working capital swings (current assets minus current liabilities) often explain why net income and CFO diverge.
CFO vs. FCF—When Each Helps
- Use CFO when you want the cleanest read on business health and dividend coverage across cycles. It strips out financing choices and CAPEX timing.
- Use FCF when you want to know whether a capital-intensive company is self-funding growth or leaning on the balance sheet.
That’s the trade-off. CFO can look great while FCF is negative because the company is investing heavily; FCF can look weak during build-out years without signaling a broken business. For utilities, telecoms, pipelines, and other heavy CAPEX names, FCF often answers “Is growth self-funded?”—and the honest answer is often “not fully.” But leverage can be a smart tool when used well.
Golden rule: when one number seems off, dig further.
Find your next buy without second-guessing
- Start with the Dividend Triangle to get a focused shortlist.

- Work from about 300 quality names instead of thousands.
- Then, verify your thesis by reviewing CFO, FCF, and debt in the company financials.

Open the Dividend Rock Star List
Cash Flow Analysis Told Us About the BCE Debacle Before It Happened
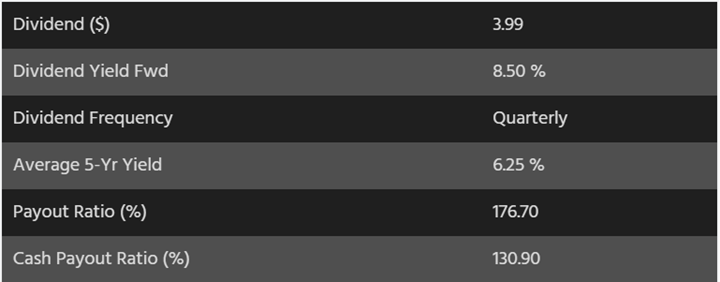
Look at the last five years for BCE (BCE.TO / BCE). We flagged the situation in August 2024 as unsustainable: payout ratio at 176.7% and cash payout ratio at 130.9%. Those metrics aren’t an automatic sell, but they’re a clear “investigate further.”
The FCF graph showed another red flag.
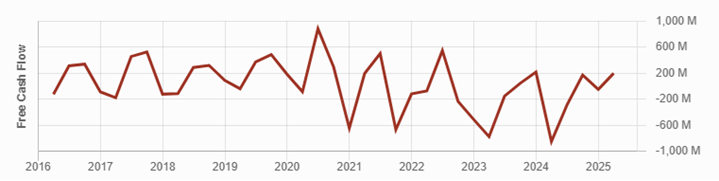
Debt kept rising—exactly what you don’t want alongside weak FCF.
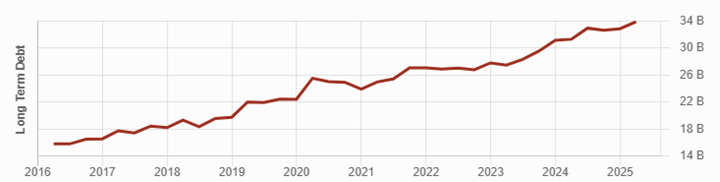
Now stack the cash picture: CFO, FCF, and dividends paid. Before the cut, BCE struggled with cash flow and borrowed systematically. We wrote then: “A corporation can’t just borrow more money each year to finance its CAPEX and dividends… If management can’t find a solution quickly, BCE won’t increase its dividend in 2025…”
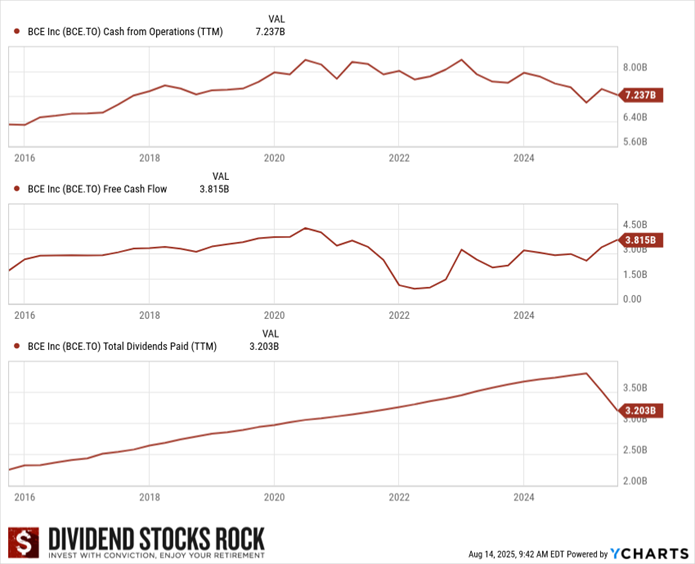
Individually, a high payout ratio or a weak FCF year isn’t enough to act. In combination, though, the picture was clear:
- Very limited revenue growth (low single digit)
- Poor EPS trend
- Declining CFO since 2022
- FCF not covering dividends
- Ever-increasing debt
If it were your money, would you lend it on those terms?
What’s to Remember About Cash Flow from Operations and Free Cash Flow
Use CFO to see through accounting noise, confirm that dividends are earned by operations, and separate temporary investment cycles from structural shortfalls. Pair it with FCF and debt for a complete picture.
When the numbers rhyme with the story, you’re likely safe. When they don’t, you’ve probably spotted a dividend trap before it springs.
Use the List that Focuses on What Matters
Start with a clean, short list, then verify the cash. Use the Dividend Rock Star List to filter the market with the Dividend Triangle and narrow thousands of stocks down to about 300 quality names.
From there, review each company’s operating cash flow in its financials to confirm the dividend is truly covered.
Explore the Dividend Rock Star List


Leave a Reply