
In 2016, I made a life-changing decision: I took a sabbatical, put my family in a small RV, and drove to Costa Rica.
Upon my return in 2017, I officially quit my job as a private banker at National Bank and started working full-time on my baby: Dividend Stocks Rock. I also decided to manage my pension account held at the National Bank. I’ve built this portfolio publicly since 2017 to make a real-life case study. I decided to invest 100% of this money in dividend growth stocks.
In August 2017, I received $108,760.02 in a locked retirement account. This means I can’t add capital to the account, and growth is only generated through capital gains and dividends. I don’t report this portfolio’s results to brag about my returns or to tell you to follow my lead. I just want to share how I manage my portfolio monthly with all the good and the bad. I hope you can learn from my experience.
As you know, I’m not a big fan of tracking my portfolio daily or weekly. However, I review my portfolio yearly to make trades and set the table for the coming year. I will share my process in this monthly update.
Performance in Review
Let’s start with the numbers as of December 2nd, 2024 (in the afternoon):
Original amount invested in September 2017 (no additional capital added): $108,760.02.
- Current portfolio value: $304,862.41
- Dividends paid: $5,078.34 (TTM)
- Average yield: 1.67%
- 2023 performance: +20.69%
- SPY= +26.19%, XIU.TO = +11.87%
- Dividend growth: +1.7%
Total return since inception (Sep 2017 – November 2024): 180.03%
Annualized return (since September 2017 – 86 months): 15.45%
SPDR® S&P 500 ETF Trust (SPY) annualized return (since Sept 2017): 15.12% (total return 174.30%)
iShares S&P/TSX 60 ETF (XIU.TO) annualized return (since Sept 2017): 11.31% (total return 115.5%)
The Yearly Portfolio Process Made Simple
As you know, I’m not a big fan of tracking my portfolio daily or weekly. In fact, I write this newsletter monthly to report my case studies, but I don’t look at all my portfolios on the first of the month. Too many things change from one month to another, resulting in listening to too much noise and doing too little.
However, I review my portfolio yearly to make trades and set the table for the coming year. I like the quiet time over the Holidays when I can reflect on the year that passed and what’s next (the last newsletter of the year will be about major themes for 2025). If you are looking to build such a process, here’s a good starting point.
#1 Lay out your investment rules
Before reviewing your portfolio, you must know what to look for. If you have not written your investment rules, now would be a great time to do so. Here’s an example of my rules (please read carefully the word example):
- 100% invested in equities.
- 50% US, 50% Canadian exposure.
- Not more than 20% in a sector.
- Invest in companies with several growth vectors in the investment thesis.
- Invest in companies with a robust dividend triangle (the metrics must match the thesis).
- Not more than 10% of my portfolio is invested in a single stock.
- All positions must be over 2% of my portfolio.
- The number of holdings is to be between 30 and 40.
- Allow up to 10% in speculative plays (maximum 5 different ideas).
- No room for dividend cutters.
Those are my investment rules. They align with my philosophy, financial situation, and risk and volatility tolerance. Depending on your situation, you can create something similar.
The key is to keep those rules clear and simple, so they are easy to follow. My goal is not to spend 63 hours reviewing my portfolio!
#2 Asset allocation, sector allocation, stock allocation
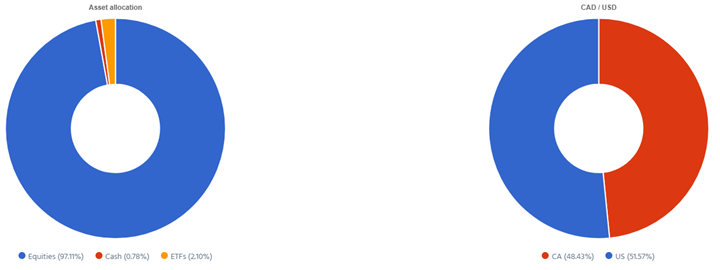
Once I have clear investment rules, I open my DSR PRO dashboard and use the global view. I first look at the asset allocation (must be 100% equities, split 50-50):
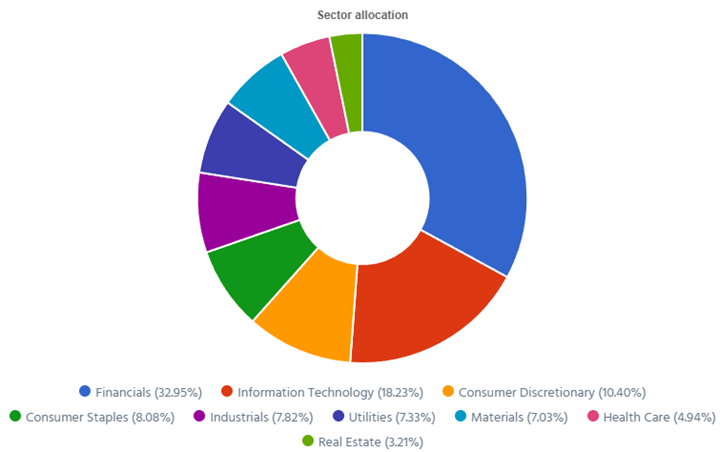
Then, I move to the sector allocation. You’ll see below that when I combine all my portfolios, I’m just slightly overweight in technology (23.80%) and financial services (22.99%). Since the 20% max in a sector is more like a guideline than a hard rule, I can tolerate a few percentage points above.
I investigate the sector whenever I’m over 20% to ensure I’m not concentrated into a single industry. The point is that I don’t want to suffer from a crisis in a specific sub-sector. For example, if there is a mortgage crisis, only my exposure to National Bank and Royal Bank will be at risk. My investment in Brookfield, Visa, and Blackrock won’t be affected (or barely).

Now that this part has been covered, I move to stock allocations by looking at the top 10 and bottom 10. For this exercise, I also ignore my investment in my Smith Manoeuvre portfolio since I’m investing $500 monthly. Therefore, I may have a few positions that will not be significant.
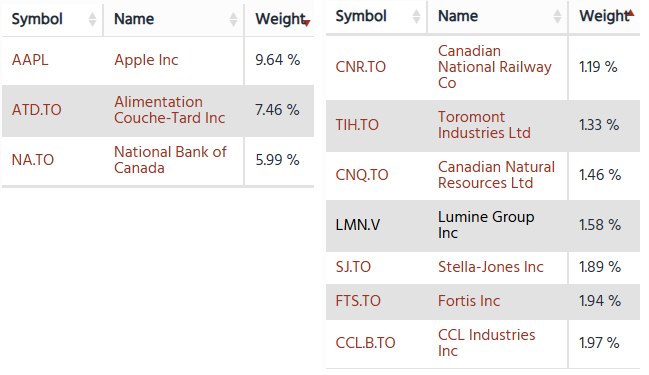
My top 10 is healthy, with a large position in Apple at 9.64%, then drops to 7.46% for Couche-Tard and 5.99% for National Bank. When I look at my smallest positions, I must reinvest some capital into Canadian National Railway (1.19%), Toromont Industries (1.33%), Canadian Natural Resources (1.46%), Stella-Jones (1.89%), Fortis (1.94%) and CCL Industries (1.97%).
The “problem” with those stocks was their weaker performance vs. other stronger performers in my portfolio or the fact that they haven’t been in my portfolio for a long time (CCL, TIH and SJ have been in my portfolio for less than 2 years).
I’m able to quickly review my top and bottom 10 simply by sorting my global view by weight:
While my asset and sector allocation are great, I know I must invest a little bit more into a few stocks. I have to take note of that if I sell anything.
#3 Sum up your quarterly reviews
Each quarter, I run my DSR PRO report and read the earnings summary for each of my holdings. I often use the term “taking mental note”, but you can also keep track in a document or an excel spreadsheet. What is worth taking a note from? When either the investment thesis or the financial metrics don’t match. For example, here’s a short list of companies that showed weaker metrics while their investment thesis is still valid:
- Alimentation Couche-Tard (ATD.TO)
- Starbucks (SBUX)
- Texas Instruments (TXN)
Do I need to extensively review Automatic Data Processing (ADP), which keeps reporting great numbers quarter after quarter? No. My investment thesis is valid; the numbers are backing the narrative, end of story.
This leaves us with the last step of the portfolio review (I told you it was a process made easy!).
#4 Dig deeper on a handful of stocks
Now that I know most of my portfolio is well invested and that I don’t have to worry about it too much, I can concentrate my review on the three companies I highlighted in step 3.
Why not review all stocks? Because I’ve done this throughout my quarterly reviews. Plus, since I did my due diligence in the first place (e.g., spending a few hours carefully analyzing the company before adding it to my portfolio), I don’t need to do an extensive review each time. Plus, if I miss anything in my quarterly review, I can always double-check by looking at my ratings:

I can then quickly review the yellow (rating of 3) and orange (rating of 2). As I mentioned several times, the DSR ratings are just two more metrics to analyze, and they are not enough to justify a buy or a sell. I see them as guides or red flags indicating where to focus my attention.
Considering my analysis, I decided to sell my shares of Texas Instruments. The reason is simple: I like the stock, and the investment thesis remains good. However, while the dividend triangle has weakened over the past two years (it’s normal since it’s a cyclical stock), the price kept rising. Plus, I’m slightly overweight in technology, making it a logical candidate to sell.
Since I have already established that I must reinvest some money into other positions, I already know what I’ll be doing during the holidays!
You can use a similar process and adjust the rules to review your portfolio once a year. Remember: it doesn’t have to be complex; it just has to be clear and simple!
Smith Manoeuvre Update
Slowly but surely, the portfolio is taking shape with 12 companies spread across 8 sectors. My goal is to build a portfolio of thriving companies with a solid dividend triangle (e.g. with positive revenue, EPS and dividend growth trends). The current portfolio yield is at 3.84% with a 5-year CAGR dividend growth rate of 9.29%. I have given more thoughts on my Smith Manoeuvre approach last month.
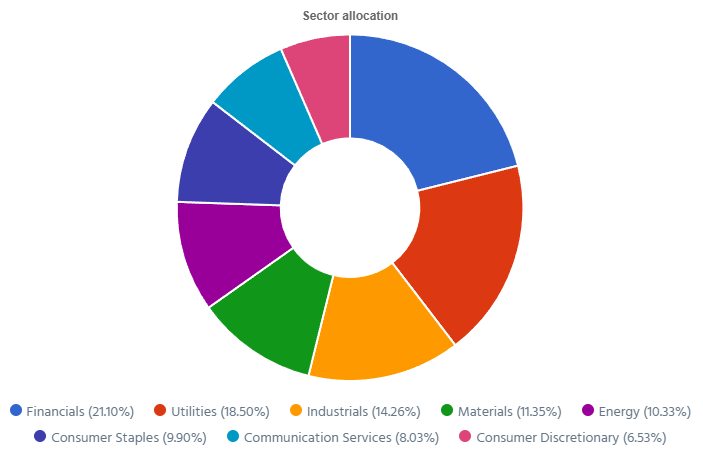
Here’s my SM portfolio as of December 2nd, 2024 (in the afternoon):
| Company Name | Ticker | Sector | Market Value |
| Alimentation Couche-Tard | ATD.TO | Consumer Staple | $1,661.40 |
| Brookfield Infrastructure | BIPC.TO | Utilities | $1,260.80 |
| Canadian National Resources | CNQ.TO | Energy | $1,699.56 |
| Capital Power | CPX.TO | Utilities | $1,786.11 |
| Canadian Tire | CTA.A.TO | Consumer Disc. | $1,086.89 |
| Exchange Income | EIF.TO | Industrials | $1,823.36 |
| Franco-Nevada | FNV.TO | Materials | 1,026.36 |
| Great-West Lifeco | GWO.TO | Financials | $857.14 |
| National Bank | NA.TO | Financials | $1,536.59 |
| Nutrien | NTR.TO | Materials | $866.58 |
| Telus | T.TO | Communications | $1,330.41 |
| TD Bank | TD.TO | Financials | $1,102.22 |
| Waste Connections | WCN.TO | Industrials | $535.06 |
| Cash (Margin) | -$191.79 | ||
| Total | $16,380.69 | ||
| Amount borrowed | -$13,500.00 |
Bought 2 shares of Waste Connections (WCN.TO) @267.53
It’s hard to pull the trigger on a stock like WCN as it is always seen to be trading at an all-time high. Nonetheless, I think my money is well-invested. Its business model is recession-proof as solid waste is a given regardless of the economic cycle. Revenue, earnings, and dividends grow steadily in the high single-digit to double-digit level. I will direct my next $500 into this holding as well.
Let’s look at my CDN portfolio. Numbers are as of December 2nd, 2024 (in the afternoon):
Canadian Portfolio (CAD)
| Company Name | Ticker | Sector | Market Value |
| Alimentation Couche-Tard | ATD.TO | Cons. Staples | $24,775.14 |
| Brookfield Renewable | BEPC.TO | Utilities | $11,558.40 |
| CCL Industries | CCL.B.TO | Materials | $10,983.00 |
| Fortis | FTS.TO | Utilities | $10,790.10 |
| Granite REIT | GRT.UN.TO | Real Estate | $9,646.08 |
| National Bank | NA.TO | Financials | $16,906.12 |
| Royal Bank | RY.TO | Financial | $11,408.80 |
| Stella Jones | SJ.TO | Materials | $10,446.30 |
| Toromont Industries | TIH.TO | Industrials | $7,336.96 |
| Cash | $387.34 | ||
| Total | $114,238.24 |
My account shows a variation of $2,389.53 (+2.14%) since November’s income report. All my Canadian holdings have reported their earnings over the past few weeks.
Alimentation Couche-Tard disappoints but raises its dividend.
Couche-Tard reported a mixed quarter as revenue increased by 6%, but EPS declined by 10%. Revenue growth was driven solely by acquisitions as same-store merchandise revenues decreased by 1.6% in the United States, by 1.5% in Europe and other regions, and by 2.3% in Canada. The company is facing consumers with strapped budgets and declining cigarette sales. However, ATD saw sequential monthly improvements, particularly in same-store merchandise revenues in the United States, and is encouraged by this positive momentum. The company also raised its dividend by 11%. ATD is still pursuing its goal to acquire 7-Eleven.
I have shared more thoughts on Couche-Tard in the episode below.
Brookfield Renewable is steady like water flowing into an electric power plant.
Brookfield Renewable reported a solid quarter with funds from operations per share up 11%. This growth was primarily driven by contributions from recent acquisitions and the commissioning of approximately 2,200 megawatts of capacity year-to-date. BEP’s diverse asset base and inflation-linked contracted cash flows also increased revenue. It is advancing its strategy by expanding its presence in the renewable energy sector, including solar and wind projects investments. BEP is also exploring opportunities in energy storage and distributed generation, aiming to capitalize on the global shift towards renewable energy and sustainable infrastructure.
CCL Industries is packing good results.
CCL Industries reported a solid quarter with revenue up 9% and EPS up 15%. The revenue growth was driven by 6.9% organic sales growth, 1.8% acquisition-related growth, and a 0.7% positive impact from foreign currency translation. Earnings were up on revenue growth and the operating margin improved by 50 basis points to 15.6%, reflecting enhanced operational efficiency.
Fortis increases dividends like clockwork.
Fortis reported a modest quarter with revenue up 2% and EPS up 1%. However, management kept its dividend growth streak alive with a 4.2% dividend increase. Revenue growth was primarily driven by higher sales in the U.S. electric and gas utilities segment, which saw a 5% increase due to favorable weather conditions and customer growth. The Canadian and Caribbean electric and gas utilities segments also contributed to the revenue increase, albeit more slowly. The company’s operating margins remained stable, reflecting effective cost management and operational efficiency.
Granite REIT is getting some love (but not enough).
Granite REIT reported another good quarter with revenue up 8% and AFFO per share up 12%. Management also announced a dividend increase of 3%. The AFFO payout ratio for the quarter and the past 9 months was 68%. This growth was primarily driven by the completion of development and expansion projects in Canada, the United States, and the Netherlands, as well as contractual rent adjustments and consumer price index-based increases. Same-property NOI on a cash basis increased by 6.2%, excluding the impact of foreign exchange.
National Bank stock goes down on great earnings.
National Bank reported a solid quarter, with revenue up 15% and EPS up 8%. Personal & Commercial banking net income was up +2%, driven by growth in personal and commercial loans and deposits, partially offset by Provisions for credit losses. PCLs increased from $65M to $96M. Wealth +17% was driven by strong revenue growth. Financial markets were up +6% and US and Intl +8%. ABA bank did great on strong volume (revenue up 25%), whereas Credigy saw its net income decline by $2M due to higher PCLs. The Bank also announced its second dividend increase of the year, bringing another 3.6% more to your pocket! Yet, the stock was down almost 4% on earnings day, which is difficult to comprehend fully!
Royal Bank is the king of banks!
Royal Bank reported a solid quarter with EPS up 16%. Personal Banking net income rose by 16%, boosted by acquiring HSBC assets last year. Commercial Banking was up 16% for the same reason (excluding HSBC, this segment would have been down 5%). Wealth Management was up by 520M as the prior year reflected the impact of impairment losses. Compared to Q3 2024, Wealth was up 2%. Insurance was up 67% due to higher insurance service results, primarily driven by business growth across most of RY’s products. Capital Markets was relatively flat. RY also raised its dividend by 4.2%!
I did my classic Canadian Banks quarterly review on my YouTube channel. Watch it below.
Stella Jones shouts “Timbeeeeeeeer” and scares investors.
Stella-Jones reported a disappointing quarter as revenue declined by 4%, but EPS tumbled by 26%. The reduction in sales primarily reflects lower sales volumes in logs, lumber, and industrial products, with industrial products generating $41M and logs and lumber contributing $30M. Although utility poles faced a drop in volume, sales were buoyed by price increases, especially in pressure-treated wood products essential for infrastructure. Gross profit decreased to CAD $188M, translating to a gross margin of 20.5%, compared to 22.7% the previous year, with lower sales volumes across all categories impacting profitability?. The stock dropped double-digits on earnings day.
Toromont Industries had better quarters.
Toromont Industries reported a mixed quarter as revenue increased by 14%, but EPS fell by 10%. The revenue growth was driven by higher revenues in both the Equipment Group and CIMCO segments. The Equipment Group experienced a 14% increase, attributed to solid new equipment deliveries and improved activity in light equipment rentals. CIMCO’s revenues rose by 17%, reflecting strong package revenue, although slightly dampened by lower product support activity levels in the U.S. The decrease in EPS and operating income was primarily due to lower gross margins influenced by an unfavorable sales mix and increased expenses.
Here’s my US portfolio now. Numbers are as of December 2nd, 2024 (in the afternoon):
U.S. Portfolio (USD)
| Company Name | Ticker | Sector | Market Value |
| Apple | AAPL | Inf. Technology | $9,572.40 |
| Automatic Data Processing | ADP | Industrials | $11,604.06 |
| BlackRock | BLK | Financials | $14,330.68 |
| Brookfield Corp. | BN | Financials | $21,169.96 |
| Home Depot | HD | Cons. Discret. | $12,846.30 |
| LeMaitre Vascular | LMAT | Healthcare | $10,570.50 |
| Microsoft | MSFT | Inf. Technology | $20,273.45 |
| Starbucks | SBUX | Cons. Discret. | $9,536.77 |
| Texas Instruments | TXN | Inf. Technology | Sold |
| Visa | V | Financials | $15,805.00 |
| Cash | $10,024.41 | ||
| Total | $135,733.53 |
My account shows a variation of +$8,650.40 (+6.8%) since November’s income report.
Brookfield is growing its assets like there is no tomorrow.
Brookfield reported another solid quarter, with distributable earnings per share up 15%. BN’s asset management business delivered 14% growth in fee-related earnings compared to the prior year’s quarter due to recent fundraising momentum across their diversified strategies, primarily from their credit funds and insurance inflows. Wealth solutions earnings doubled compared to last year, benefiting from the acquisition of American Equity Life, increased annuity sales, and strong investment performance.
Home Depot had a tough quarter, but there is light for 2025.
Home Depot did better than expected, with revenue up 7%, but EPS was down 1%. The revenue growth was primarily driven by improved engagement in seasonal goods and outdoor projects, as well as increased demand related to hurricane preparations and subsequent repairs. However, comparable sales decreased by 1.3%, with U.S. comparable sales down 1.2%, indicating some variability across different market segments. EPS was down, affected by operating margin at 13.5%, down from 14.3% in Q3 2023, reflecting increased costs and investments impacting profitability. The company updated its fiscal 2024 guidance and anticipates full-year revenue growth of approximately 4%.
I even see HD as a stock to buy now and hold for ever.
Best 10 Stocks to Buy Now and Hold Forever – Part 1 [Podcast]
My Entire Portfolio Updated for Q3 2024
Each quarter, we run an exclusive report for Dividend Stocks Rock (DSR) members who subscribe to our very special additional service called DSR PRO. The PRO report includes a summary of each company’s earnings report for the period. We have been doing this for an entire year now and I wanted to share my own DSR PRO report for this portfolio. You can download the full PDF showing all the information about all my holdings. Results have been updated as of October 4th, 2024.
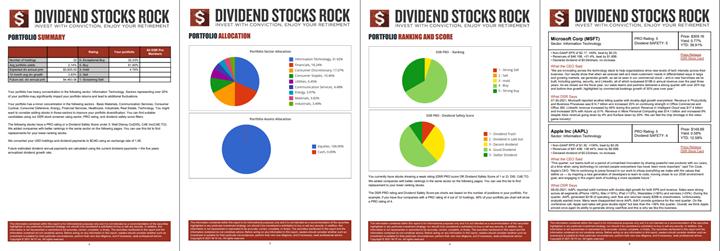
Download my portfolio Q3 2024 report.
Dividend Income: $450.67 CAD (+6.6% vs November 2023)
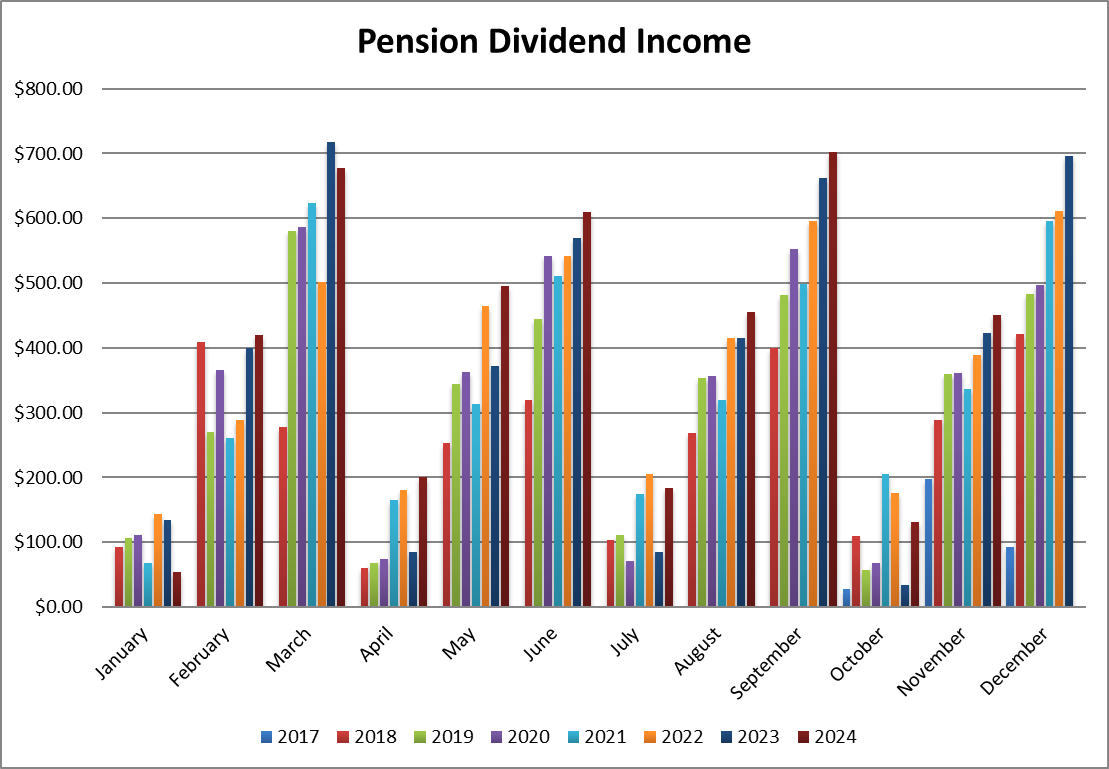
Despite selling a few shares of Apple last year, I’m still showing more dividends than last year. All other companies increased their dividends, and the currency factor is quite generous (+5.5%!).
Dividend growth over the past 12 months:
- Granite REIT: +3.10%
- National Bank: +7.8%
- Royal Bank: +5.2%
- Texas Instruments: +4.6%
- Apple: I sold shares
- Starbucks: +18.35%
- Currency: +5.49%
Canadian Holding payouts: $260.60 CAD.
- Granite REIT: $35.20
- National Bank: $133.10
- Royal Bank: $92.30
U.S. Holding payouts: $135.34 USD.
- Texas Instruments: $68.00
- Apple: $10.00
- Starbucks: $57.34
Total payouts: $450.67 CAD.
*I used a USD/CAD conversion rate of 1.4044
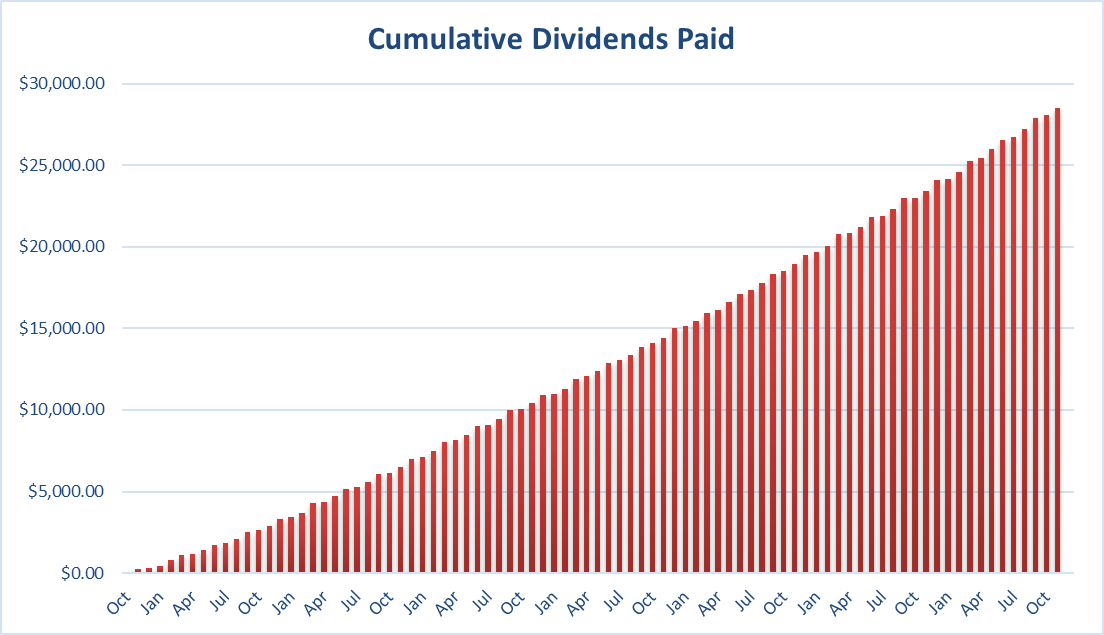
Since I started this portfolio in September 2017, I have received a total of $28,495.57 CAD in dividends. Keep in mind that this is a “pure dividend growth portfolio,” as no capital can be added to this account other than retained and/or reinvested dividends. Therefore, all dividend growth comes from the stocks and not from any additional capital added to the account.
Final Thoughts
Although the Market has been kind to us this year, that doesn’t mean it will be the same in 2025. That’s why I review my portfolio each year and ensure that most of my holdings show solid financial metrics. If anything bad happens in the coming months, I’ll continue to sleep well at night since I will know that my companies are robust enough to weather the storm without being severely damaged.
Cheers,
Mike.


Leave a Reply